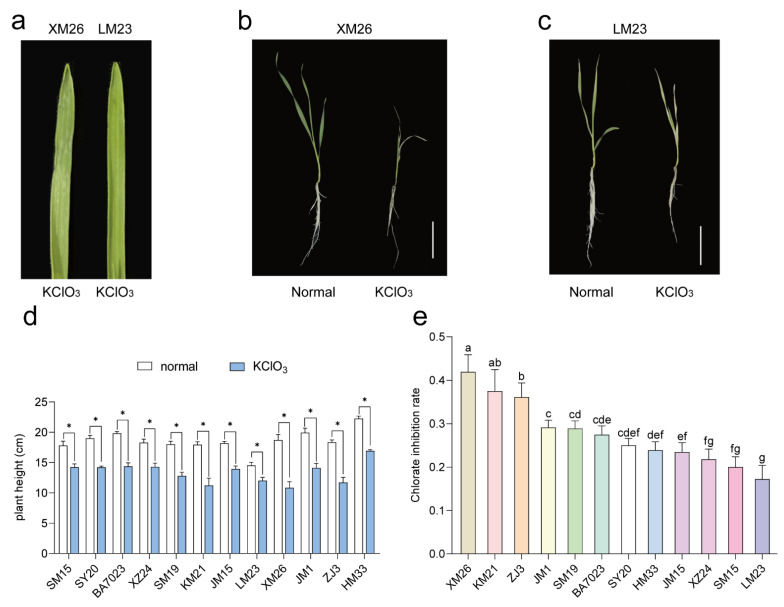
Figure 1.
Chlorate tolerance analysis of 12 wheat varieties during the seedling stage. (a) Shapes of the shoots of XM26 and LM23 after KClO3 treatment for 20 h. (b,c) Phenotype of whole XM26 and LM23 plants under normal conditions (left) and KClO3 treatment (right) for 4 d. (d,e) Plant heights and chlorate inhibition rates in different wheat varieties treated with 0 (normal) and 4 mmol/L KClO3 for 4 d. * indicates a significant difference (p < 0.05) between different treatments. Lowercase letters indicate significant differences (p < 0.05) between different wheat varieties.

