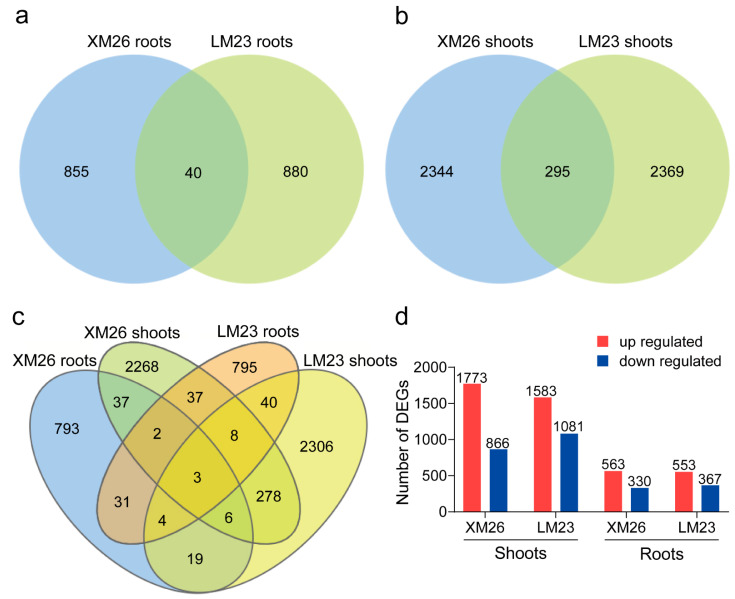
Figure 3.
Differentially expressed genes (DEGs) between the two wheat varieties at the seedling stage under low nitrogen (LN) relative to control (CK) conditions. (a–c) Venn diagrams of DEGs in roots and shoots of XM26 and XM23. (d) Histogram showing the number of DEGs in roots and shoots of XM26 and LM23. Red and blue represent upregulated and downregulated genes, respectively.

