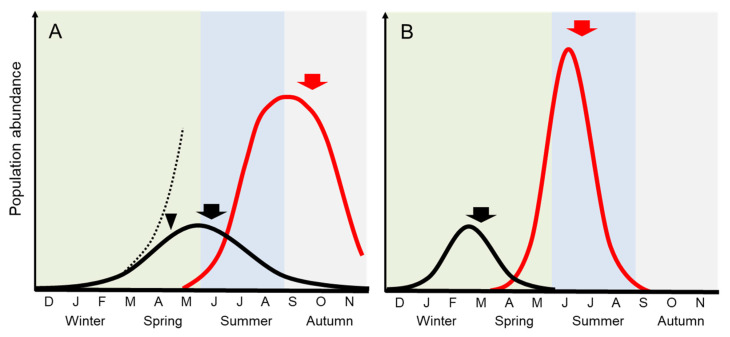
Figure 2.
Comparison of seasonal abundance change between the attached populations and the green tides of Ulva in the temperate region. Arrowhead indicates the period when biomass increase is suppressed mainly by light limitation. Arrows show the period when allocation of biomass to sporulation begins to be greater than vegetative growth. (A) The attached U. australis modified from [9,12] (black line). Dotted line is a growth curve predicted in case of no light limitation. Ulva ohnoi green tide modified from [11] (red line); (B) Attached U. prolifera in brackish water modified from [13,14] (black line). The U. prolifera green tide in the Yellow Sea modified from [4,15] (red line).

