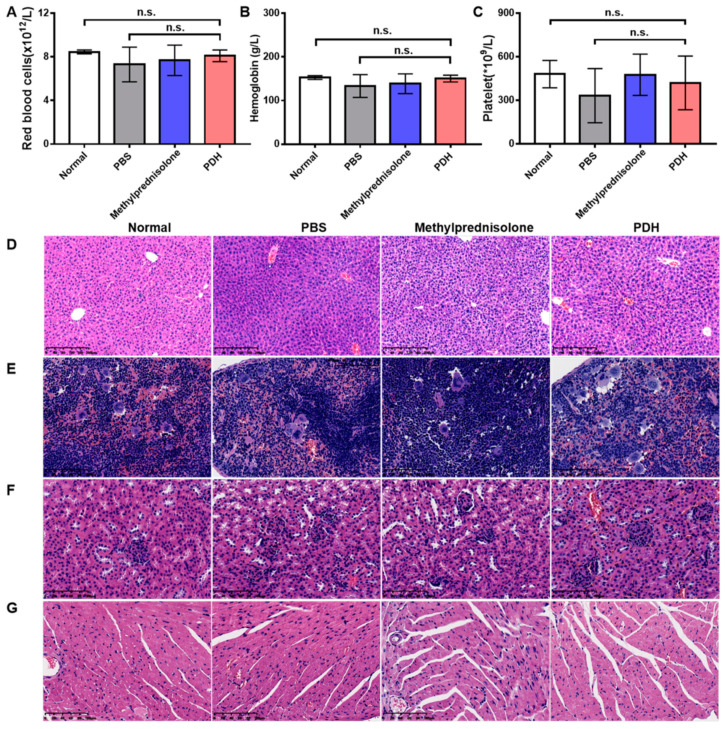
Figure 5.
The biosafety of PDH nanoparticles in ALI mice. The changes in red blood cells (A), hemoglobin (B), and platelets (C) detected by automatic blood analyzer (n.s. is non-significant, n = 6). Representative images of liver ((D), scale bar = 200 μm), spleen ((E), scale bar = 100 μm), kidney ((F), scale bar = 100 μm), and heart ((G), scale bar = 100 μm) identified with hematoxylin and eosin staining.

