Figure 1.
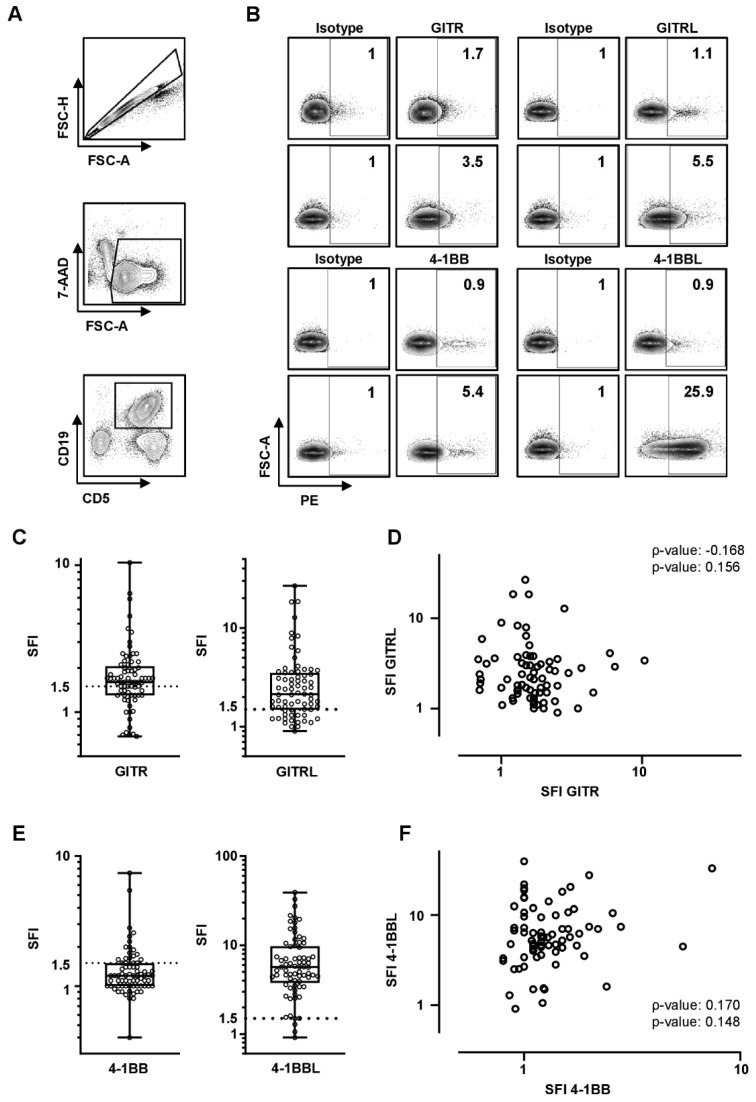
GITR/GITRL and 4-1BB/4-1BBL expression on chronic lymphocytic leukemia cells. GITR/GITRL/4-1BB/4-1BBL expression levels were analyzed on CLL cells by flow cytometry. (A) An exemplary gating strategy is depicted: singlets, viable (7-AAD-), CD5+CD19+ CLL cells. (B) Gating strategy for low and high GITR/GITRL/4-1BB/4-1BBL expression levels of exemplary CLL samples compared to isotype is depicted. SFIs are shown on the right corner of each plot. (C,E) GITR/GITRL/4-1BB/4-1BBL expression levels on peripheral CLL cells (n = 73) are shown as SFI levels of GITR, GITRL, 4-1BB, and 4-1BBL positive CLL samples (boxplots with min/max whiskers). The SFI ≥ 1.5 is defined as positive and is depicted by dotted line. (D,F) Correlation of GITR and GITRL, and 4-1BB and 4-1BBL SFI levels on CLL cells is shown (single values, spearman correlation (ρ)).

