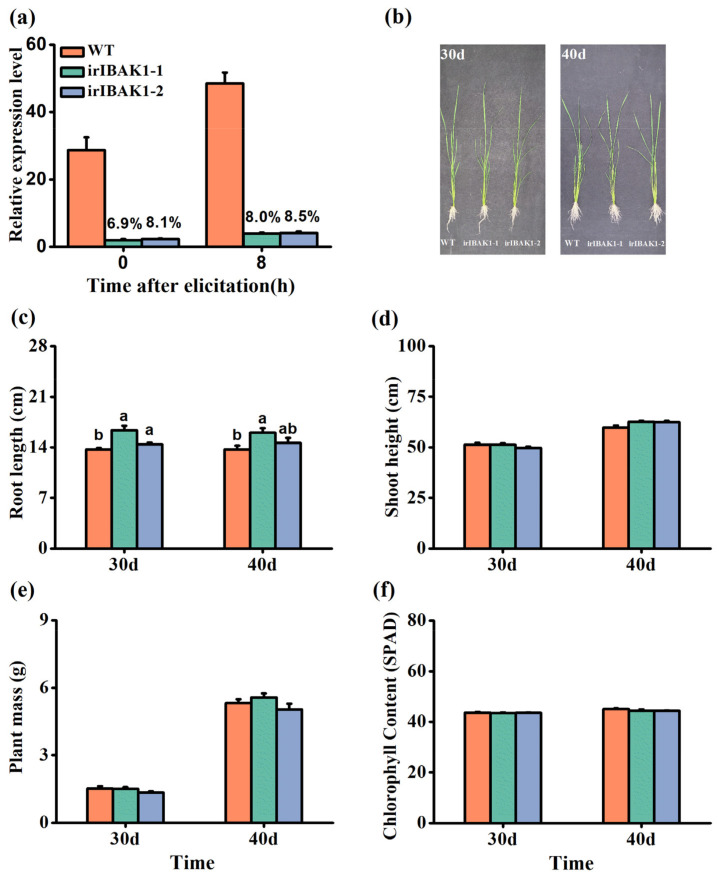
Figure 3.
Transgenic lines silencing OsI-BAK1 and their growth phenotypes. (a) Mean expression levels (+SE, n = 5) of OsI-BAK1 in wild-type (WT) and ir-ibak1 plants at 0 and 8 h after BPH infestation. Percentages indicate the percentage of the expression levels of OsI-BAK1 in ir-ibak1 plants compared to the expression levels of OsI-BAK1 in WT plants. (b) The growth phenotype of 30- and 40-day-old WT and ir-ibak1 plants in the greenhouse. (c–f) Mean root length (c), shoot height (d), plant mass (e) and chlorophyll content (f) (+SE, n = 10) of WT and ir-ibak1 plants at 30 or 40 days old in the greenhouse. Different letters represent significant differences among the lines (p < 0.05, Tukey’s HSD post-hoc tests).

