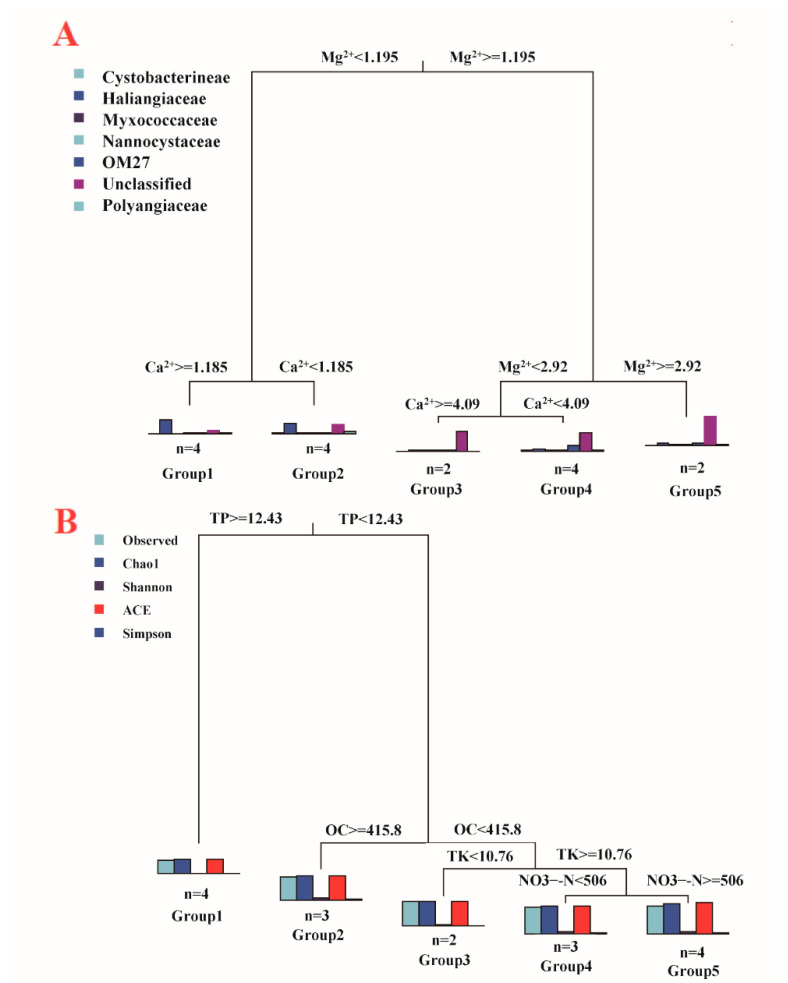
Figure 5.
Multivariate regression tree (MRT) analysis of the correlation between myxobacteria composition (A) and diversity (B), and environmental factors. (A): The bar plots illustrate the relative abundance of each order, and the bar plots represent the community composition dynamics among the splits. (B): Diversity indices, including Observed OTU richness, Chao1, Shannon, ACE, and Simpson index, standardized for MRT analysis. Bar plots show the multivariate means of diversity among each split. The numbers under the bar are the numbers of samples in each group. TP: total phosphorus, OC: organic carbon, TK: total potassium, NO3−-N: nitrate nitrogen.

