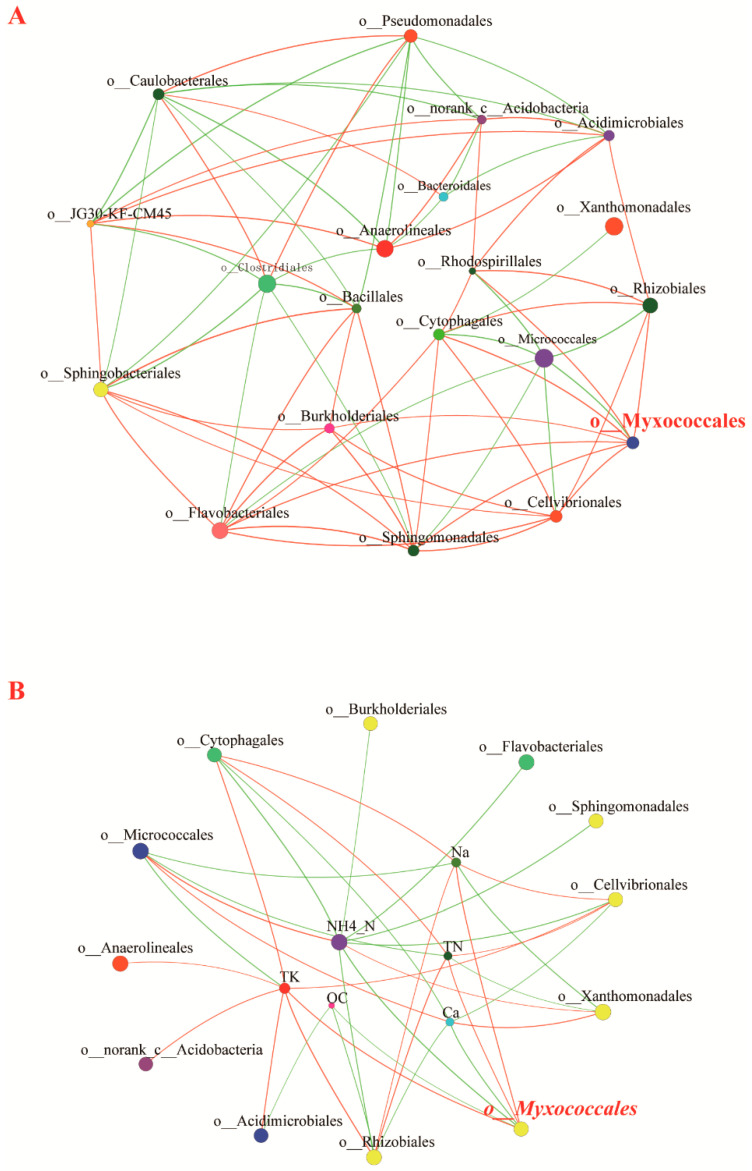
Figure 6.
Distribution of predatory myxobacteria in different compost manures. Single (A) and two-factor (B) correlation network analysis at the order level. A network graph was constructed to illustrate a positive or negative correlation between different bacterial orders. A red link indicates a positive correlation between two individual nodes, whereas a green link indicates a negative correlation. Different nodes represent different bacteria orders or environmental factors. TN: total nitrogen, OC: organic carbon, TK: total potassium, NH4+-N: ammonium nitrogen.

