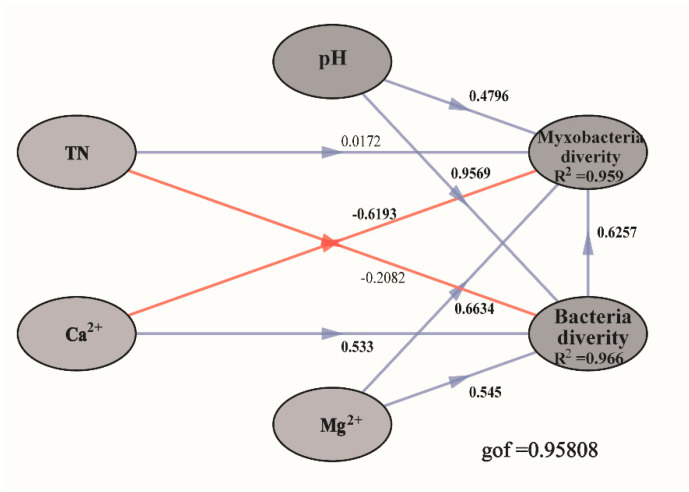
Figure 7.
Structural equation models (SEMs) showing the effects of pH, total nitrogen (TN), Calcium ions (Ca2+), Magnesium ions (Mg2+), and bacterial diversity on myxobacteria diversity. Values on the arrows represent the path coefficients. Red and blue lines indicate the significant (p < 0.05) and non-significant (p > 0.05) relationships, respectively. The “gof” indicates the goodness of fit. R2 denotes the proportion of variance explained. Bacterial and myxobacteria community diversity is represented using α-diversity indices (Observed OTU richness, Chao1, and Shannon).

