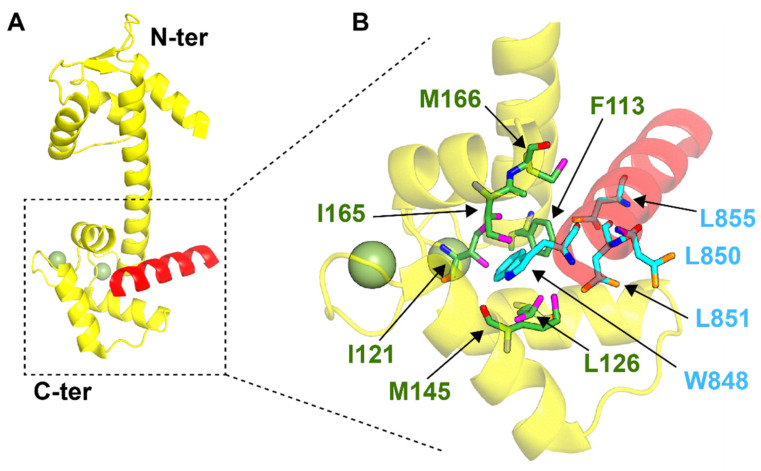
Figure 2.
Crystal structure of the complex HsCEN2/P17-XPC (PDB: 2OBH). (A) Global view of the complex. The centrin molecule is represented in yellow and the P17-XPC peptide is shown in red. The Ca2+ ions at the C-terminal binding sites of the centrin molecule are represented as smudge green spheres. (B) Magnification of the binding site of HsCEN2. Key residues, defining the interface of interaction, are reported as green (HsCEN2) and cyan (P17-XPC) residues.

