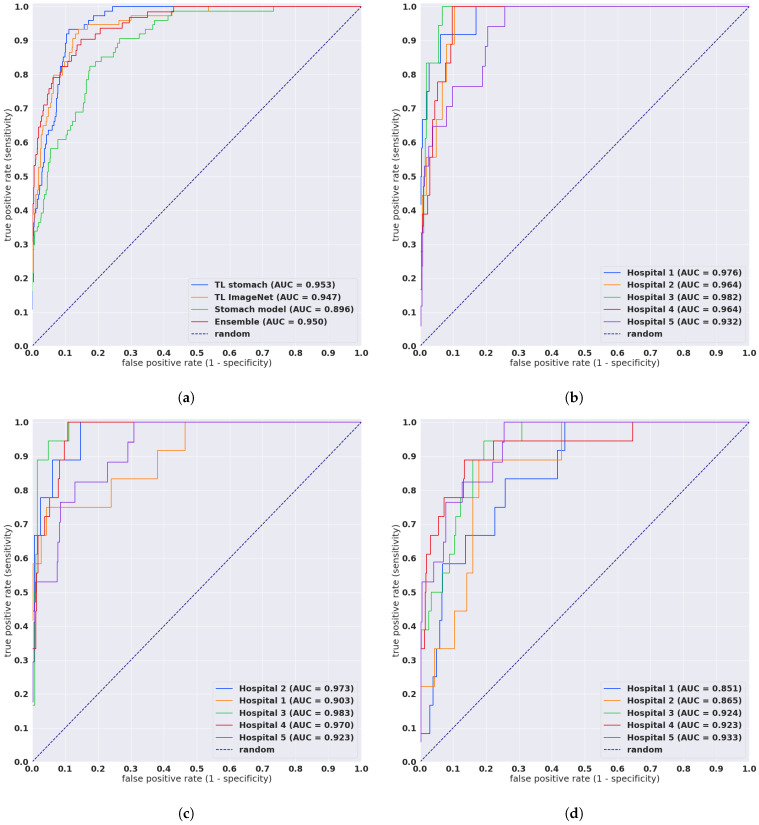
Figure 2.
ROC curves for the four models as evaluated on the combined test sets and each test set separately. (a) Evaluation of the four models on the combined test set (n = 1741), (b) TL stomach model on the test sets that had poorly differentiated ADC, (c) TL ImageNet model on the test sets that had poorly ADC, (d) Stomach model on the test sets that had poorly differentiated ADC.

