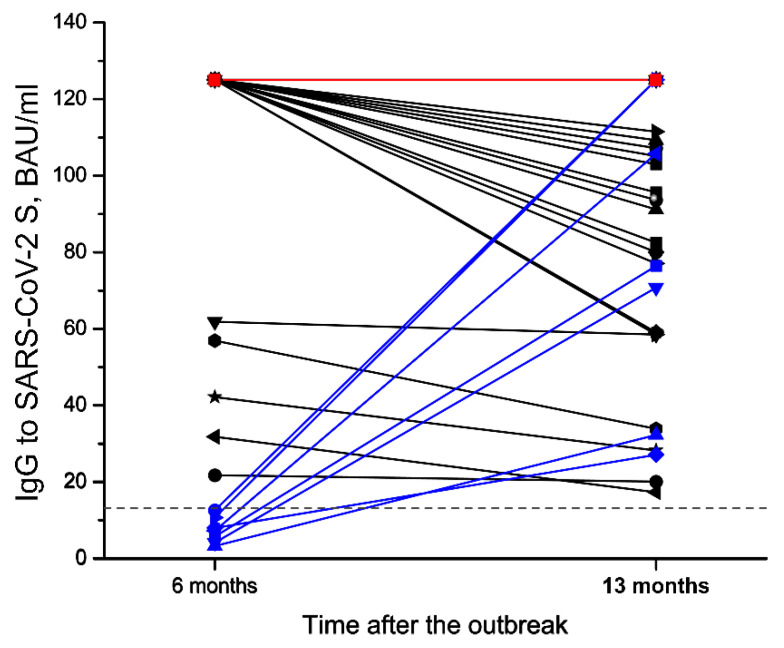
Figure 3.
The levels of SARS-CoV-2-specific IgG in a group of previously infected non-vaccinated participants (n = 39) including 1 reinfection case (red line) in the second and the third serological testing. Between the 6th and 13th month after SARS-CoV-2 infection, a decline of virus-specific IgG levels was observed in 17 individuals (black lines); the IgG levels remained stable in 14 individuals (overlapping red lines) and increased in 7 individuals (blue lines).

