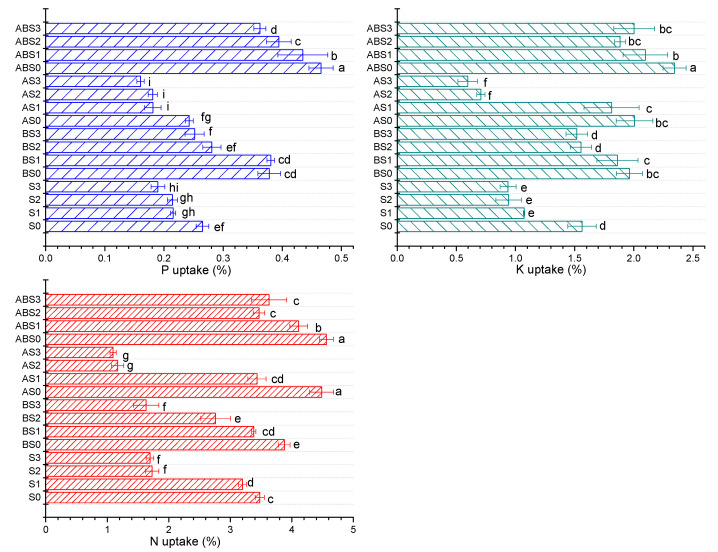
Figure 4.
Effect of biochar and/or AMF on percentage of N, P, and K uptake by the maize plant under salinity stress. Data present the mean ± standard deviation of three replicates and mean values followed by different letters are significantly different at p < 0.05 according to Duncan multiple range test. The significance of acronyms is the same as in Figure 1.

