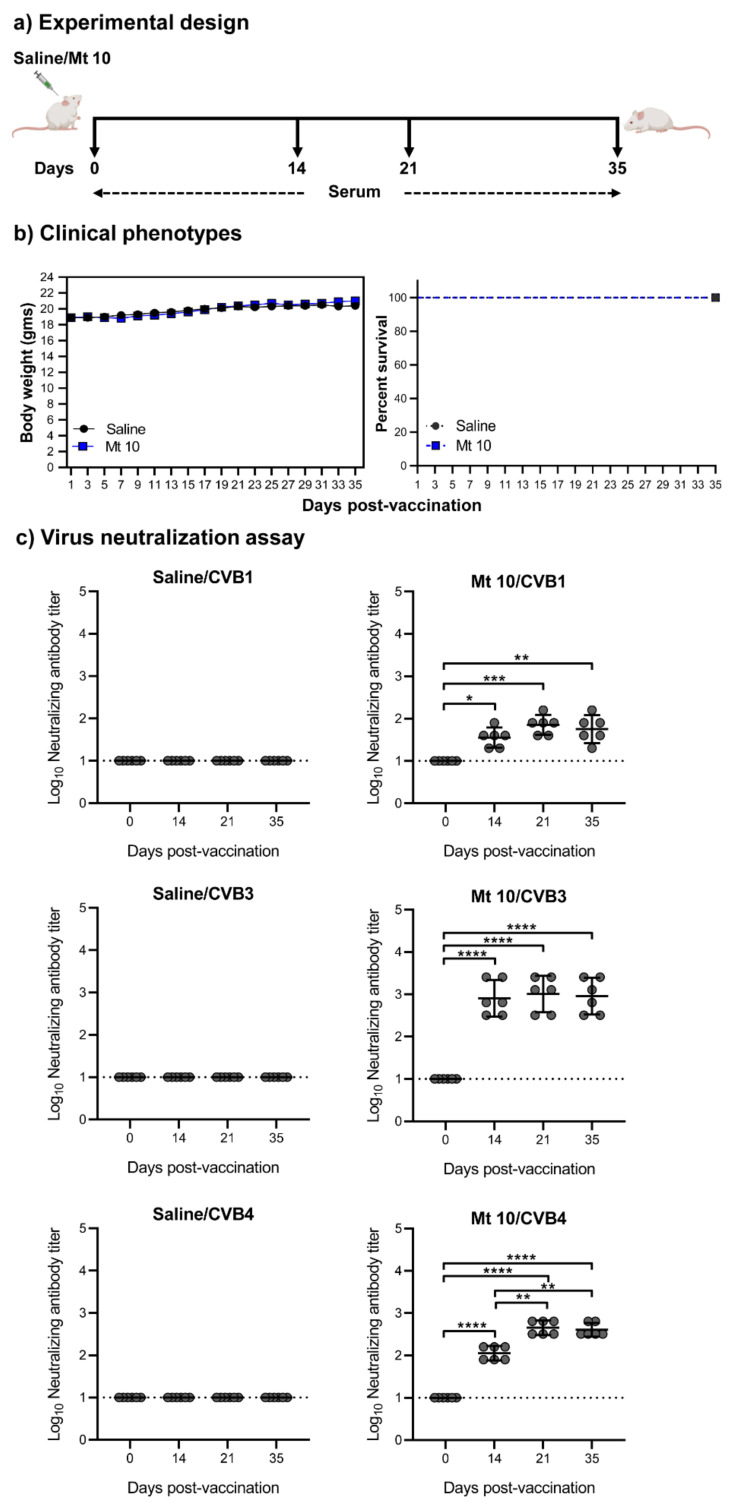
Figure 1.
Vaccine virus produces nABs against multiple CVB serotypes. (a) Experimental design. A/J mice were vaccinated with Mt10 virus (n = 18); saline recipients served as controls (n = 15). Sera were collected on days 0, 14, 21, and 35 post-vaccination and terminated on day 35. (b) Clinical phenotypes. Body weights were measured once every two days until termination and compared between groups (left panel), and survival rates were tabulated (right panel). (c) Virus neutralization assay. Sera were obtained from saline and vaccine recipients on days 0, 14, 21, and 35, serial dilutions up to 1:20,480 were made, and samples were incubated with CVB1 (top panel), CVB3 (middle panel), or CVB4 (bottom panel). The mixtures were later transferred to plates containing monolayers of LLC-MK2 cells for CVB1 or Vero cells for CVB3 and CVB4 and incubated for four days to calculate the percentage neutralization based on CPE caused by the viruses. Data from n = 6 samples, each representing a pool of sera from 3 to 5 mice, are shown. Two-way ANOVA with a Sidak’s post-test was used to compare nABs and body weight changes in the saline group relative to the vaccine-recipient group; log-rank test with Bonferroni correction was used to compare survival curves. * p ≤ 0.05, ** p ≤ 0.01, *** p ≤ 0.001, and **** p ≤ 0.0001.

