Figure 2.
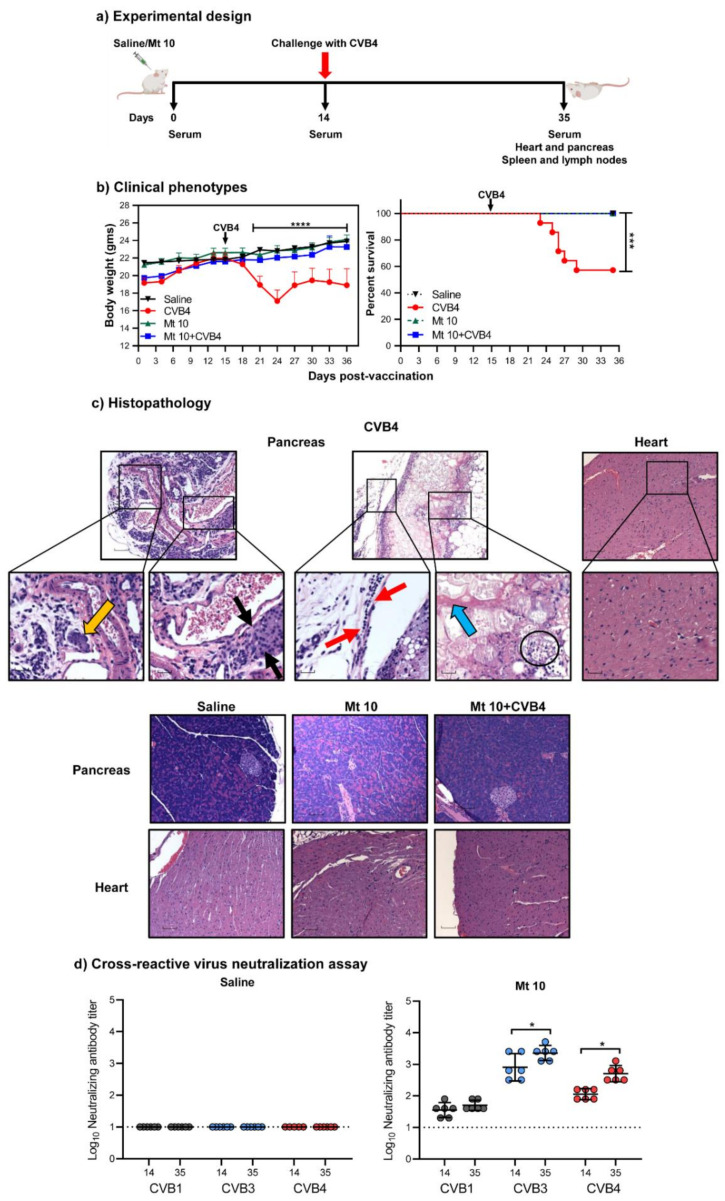
Vaccine virus offers cross-protection against CVB4 infection in challenge studies. (a) Experimental design. Two groups of mice each were given saline or vaccinated with the vaccine virus on day 0 after the serum was collected. After 14 days, serum was collected again, and one group from each treatment was challenged with CVB4. Experiments were terminated 21 days post-challenge, and serum and tissues were collected for in vitro experimentation. (b) Clinical phenotypes. Body weights (left panel) and survival rates (right panel) of different groups are shown. (c) Histopathology. Hearts and pancreata were collected from the indicated groups and processed by H and E staining to evaluate for any inflammatory changes. Representative pancreatic and heart sections are shown. Pancreatic sections and their insets from the CVB4 group had a cluster of acinar cells (orange arrow) and showed atrophy (black arrows), lymphocytic infiltrates (red arrow), necrosis (blue arrow), and karyorrhexis debris from necrotic adipocytes (circle), as opposed to normal sections in the saline, vaccine, and vaccine/CVB4-challenged groups. Magnification, 20×; scale bars, 20 µm. Data sets obtained from three individual experiments, each involving n = 3–8 mice, are shown. (d) Cross-reactive virus neutralization assay. Sera were collected from saline and vaccine/CVB4-challenged groups on days 14 and 35, and virus neutralization assays were performed on LLC-MK2 (for CVB1) or Vero cell (for CVB3 and CVB4) monolayers. Incubation was continued for four days to calculate the nAB titers based on CPE. Data from n = 6 samples, each representing a pool of sera from 3 to 5 mice, are shown. Two-way ANOVA with a Sidak’s post-test was used to compare body weight changes in the saline, vaccine, and vaccine/challenged groups relative to the CVB4 group; log-rank test with Bonferroni correction was used to compare survival curves. * p ≤ 0.05, *** p ≤ 0.001, and **** p ≤ 0.0001.

