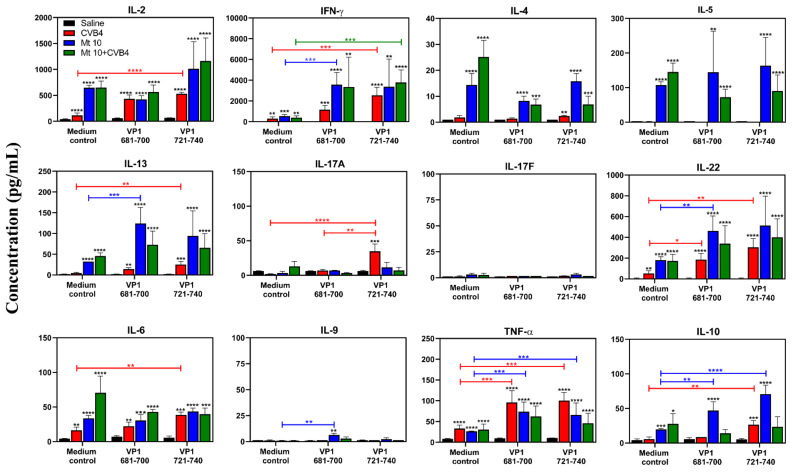
Figure 5.
T-cell responses induced in mice vaccinated and infected with CVB4 were skewed towards mainly the Th1 phenotype. Supernatants collected on day 3 post-stimulation with or without peptides (VP1 681–700, VP1 721–740) from the indicated groups were analyzed for cytokines using LEGENDplex cytokine bead array as described in the methods section. Mean ± SEM values obtained from three individual experiments, each involving n = 3–6 mice, are indicated. Unpaired Student’s t-test (two-tailed) or two-way ANOVA was used to determine significance between various treatment groups. * p ≤ 0.05, ** p ≤ 0.01, *** p ≤ 0.001, and **** p ≤ 0.0001. Black asterisk indicates p values from the comparison of treatment groups with the saline group.

