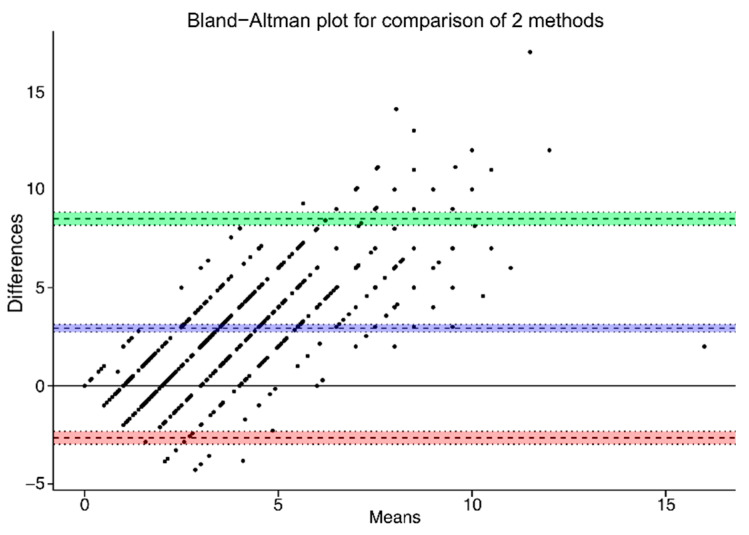
Figure 3.
Bland–Altman plot of Q9a, agreement between number/slices of bread reported during the DH and the FFQ (n = 848). The purple/blue line represents the mean difference between the two methods, and the red and green lines represents the limits of agreements corresponding to ±1.96 SD (lower agreement: −2.65 slices/day, upper agreement: 8.51 slices/day).

