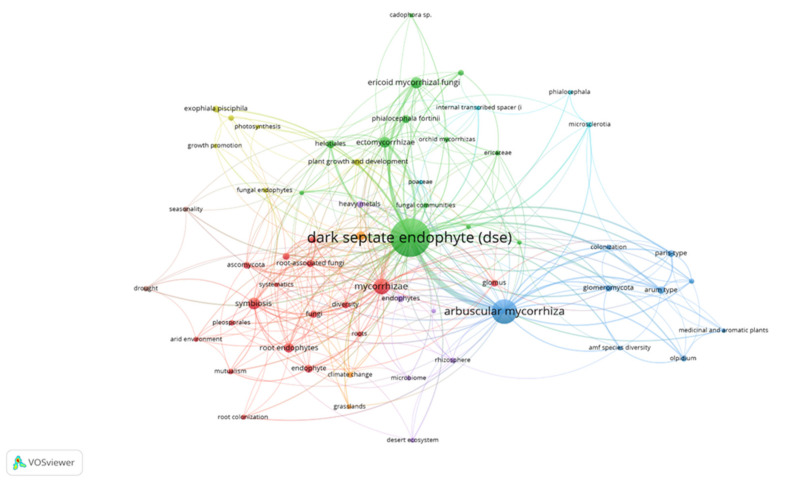
Figure 1.
Network map of the co-occurrence matrix for the 547 documents published in DSE research. VOSviewer software (version 1.6.15, Leiden University, The Netherlands) was used to map the frequency of keyword co-occurrence networks. Differences in font size imply differences in relevance. The different colours refer to the groups or clusters formed.

