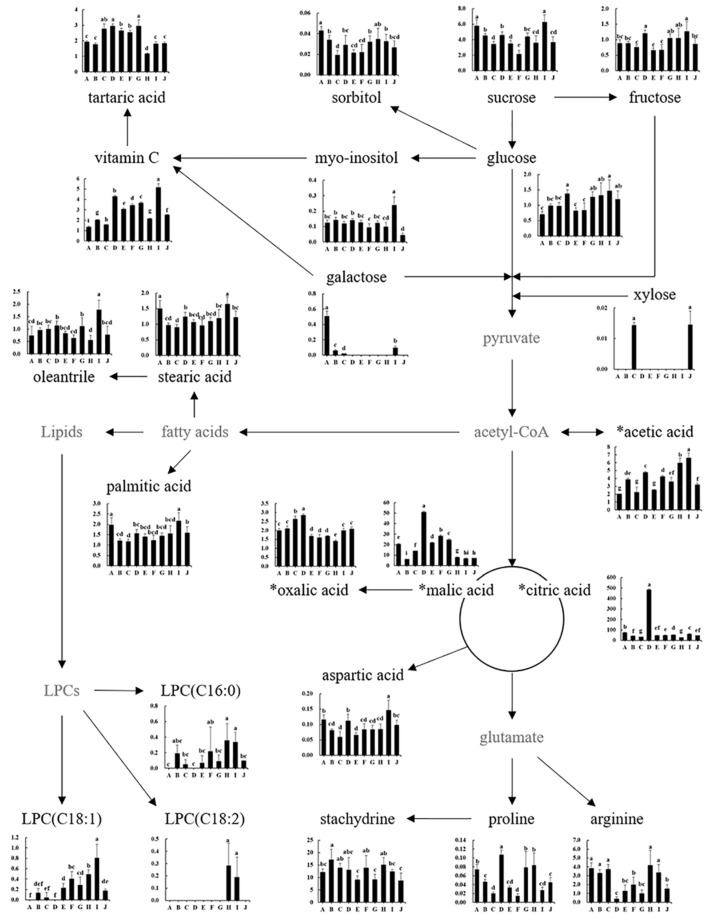
Figure 3.
Schematic diagram of primary metabolomic pathway and relative abundance of citrus flesh metabolites. The Y-axis shows the normalized chromatogram intensity, and the X-axis shows citrus varieties. A, Changshou kumquat; B, Satsuma mandarin; C, Natsumi; D, Jeramon; E, Saebyeolbong; F, Tamnaneunbong; G, Shiranui; H, Kanpei; I, Setoka; J, Navel orange; LPC, lysophosphatidylcholine. * Organic acid compounds were quantitatively analyzed with authentic standards. The different letters on the bars indicate significant differences at p < 0.05.

