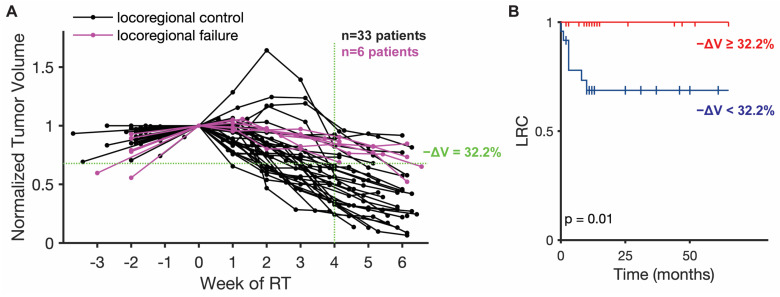
Figure 1.
Patient tumor volume trajectories and correlation with locoregional control (LRC). (A) Longitudinal tumor volume trajectories for all 39 patients normalized by initial patient tumor volume at start of RT with one measurement before the start of RT and weekly measurements during the course of treatment. Patients with eventual locoregional failure are highlighted in purple. The indicated median volume reduction (−ΔV = 32.2%) at week 4 of RT perfectly separates the patients with locoregional control (LRC) and locoregional failure. (B) Kaplan–Meier survival plot for locoregional control (LRC) separated by percent tumor volume reduction (−ΔV = 32.2%) at 4 weeks of RT.

