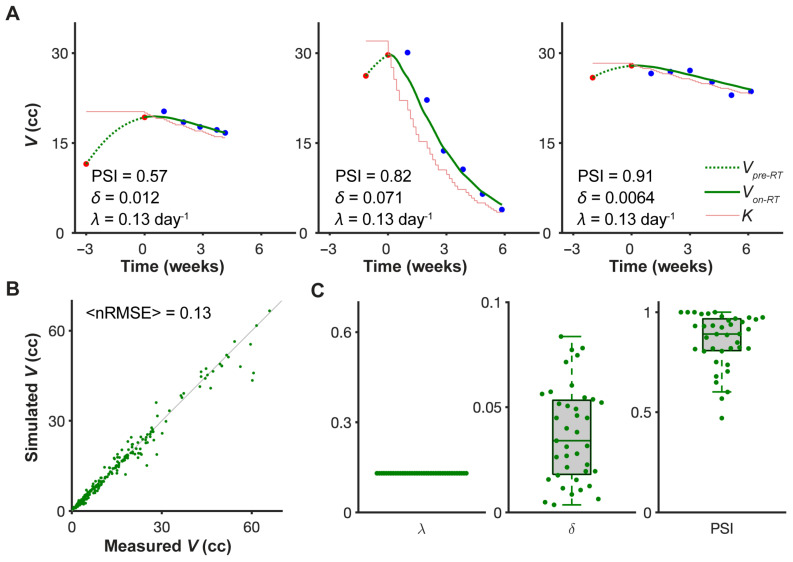
Figure 4.
Model fit to longitudinal tumor volume data. (A) Representative model fits for three patients arranged in order of increasing PSI values. Red dots are measured pre-treatment tumor volumes; black dots on-treatment tumor volumes; the dashed green curves are the calculated pre-treatment tumor growth trajectory; the solid green curves are the fitted on-treatment tumor volume trajectories; and the thin red line indicates the calculated value of the tumor carrying capacity both before and during treatment. (B) Correlation of measured tumor volumes and fitted tumor volumes for all 39 patients with indicated average normalized root mean square error (<nRMSE>). Green dots indicate individual weekly tumor volumes. (C) Parameter distributions for all 39 patients. Volumetric tumor growth rate, λ = 0.13 day−1, was fixed for all patients.

