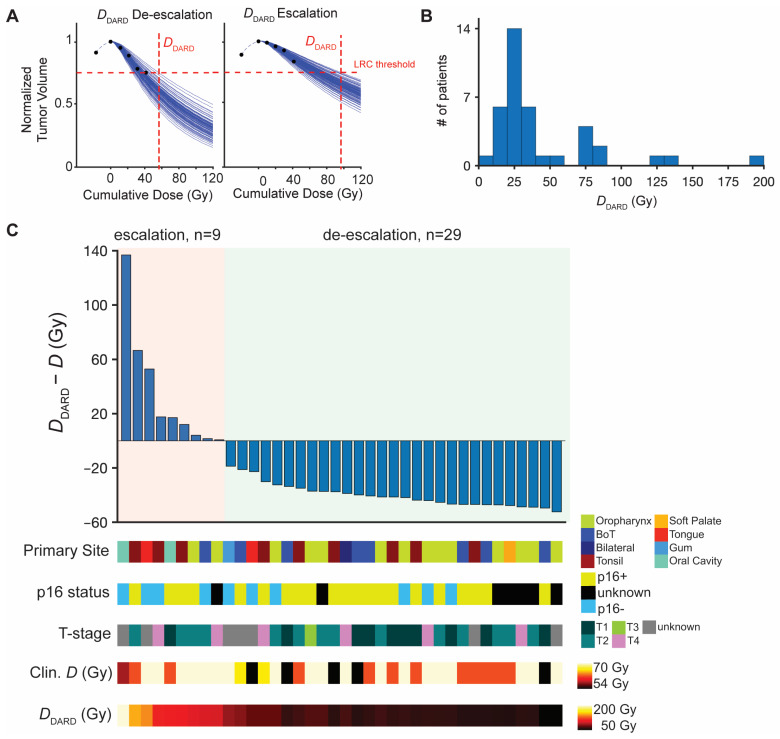
Figure 5.
Dose personalization and trial results using DDARD. (A). Example calculations of finding minimum RT dose for locoregional control, DDARD, for two patients using 4 tumor volume measurements (1 before start of RT and 4 from weeks 1–4 of RT). Black dots are normalized tumor volume measurements; blue curves the 100 projected tumor volume forecasts; horizontal dashed line the volume reduction threshold associated with LRC; and the vertical dashed line DDARD, the minimum dose where all 100 trajectories are below the LRC threshold. (B). Histogram of calculated DDARD values for all 39 patients. (C). Waterfall plot of difference between DDARD and the actual dose received in the clinic, where ΔD > 0 indicates dose escalation and ΔD < 0 indicates dose de-escalation for the 38 patients on the trial. Individual patient characteristics of interest (primary tumor site, p16 status, T-stage, cumulative dose received in the clinic, and DDARD) are indicated for each patient below the waterfall plot.

