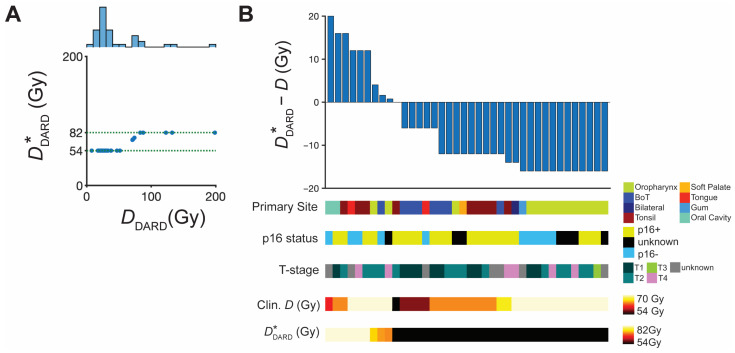
Figure 6.
Dose adjustment to and subsequent in silico trial results. (A) Scatter plot of and DDARD limited to the moderate escalation/de-escalation range of (54,82) Gy for 38 patients. A histogram of the DDARD is projected above the scatterplot. (B) Waterfall plot of difference between and the actual dose received in the clinic, where ΔD > 0 indicates dose escalation and ΔD < 0 indicates dose de-escalation for the 38 patients that remained on the trial. Individual patient characteristics of interest (primary tumor site, p16 status, T-stage, cumulative dose received in the clinic, and ) are indicated for each patient below the waterfall plot.

