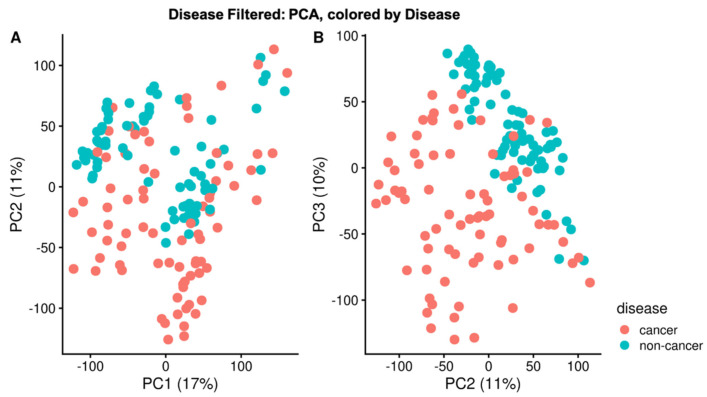
Figure 1.
PCA by disease. PCA was performed on the normalized intensities of filtered corresponded peaks. Cancer and non-cancer samples separate partially along PC2 (Panel (A)) and more clearly along PC2 and PC3 (Panel (B)). This strongly suggests that PC2 and PC3 capture some of the biological variance between cancer and non-cancer Separation by disease class does not occur along PC1, instead, PC1 corresponds to the instrument on which the spectrum was acquired (Figure S1).

