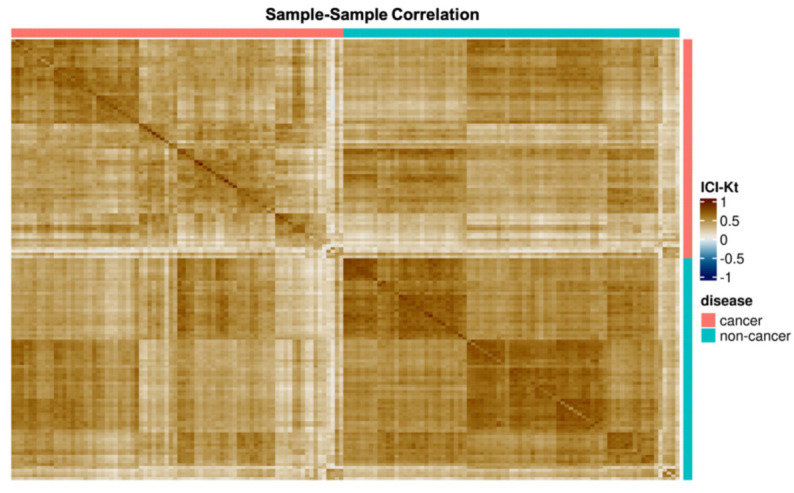
Figure 2.

Correlation heatmap by disease. In general, samples belonging to the same disease class correlate more strongly with other samples in the same disease class. Stronger correlation patterns are observed within the non-cancer samples as compared to the cancer samples. In both cancer and non-cancer samples, there are multiple subgroups of samples that correlate more strongly with one another as well as occasional samples that have poor correlation with any other sample.
