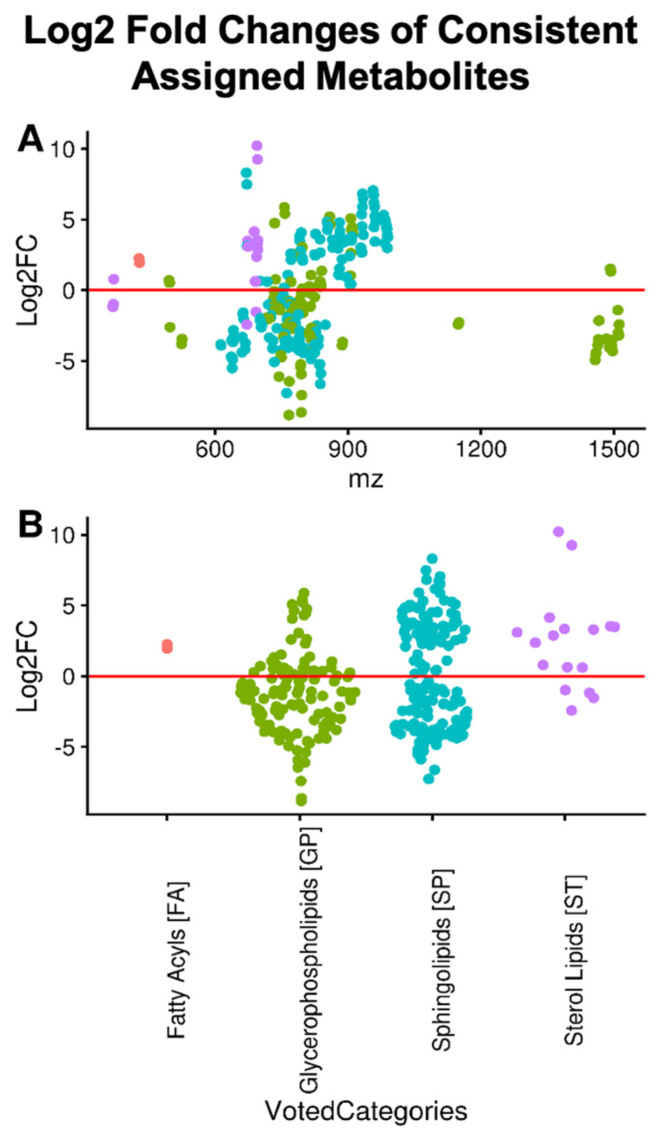
Figure 3.
Log2 fold change by category and m/z. The Log2 fold-change (Log2FC) of corresponded peaks assigned to one lipid category are shown in panel (A) with respect to m/z and by class in panel (B). The extremely high fold-changes observed for some members of the sphingolipid and sterol lipid categories are due, in part, to imputed values. Most of the differentially abundant lipids occur in the 600 to 1000 m/z range; however, this region also has the highest density of assignments. Although no lipid category is exclusively more abundant, sterols are predominantly more abundant while substantial numbers of both sphingolipids and glycerophospholipids are more and less abundant.

