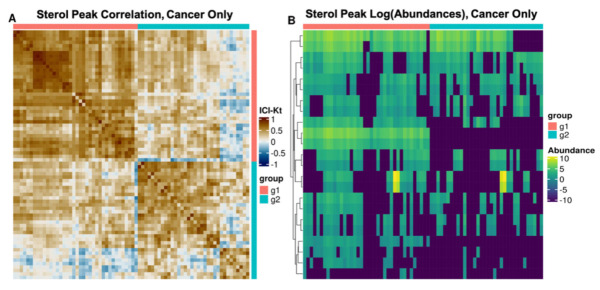
Figure 5.
Sterol-only cancer sample-sample correlation heatmap. ICI-Kendall-tau correlation heatmap (A) and abundance heatmap across samples (B). Both plots show that the cancer samples can be separated into two groups based on the sample-sample correlation; however, these groups do not correspond to a histological subtype of NSCLC. As indicated in Figure 4, there also appear to be two main groups of sterol peaks in (B).

