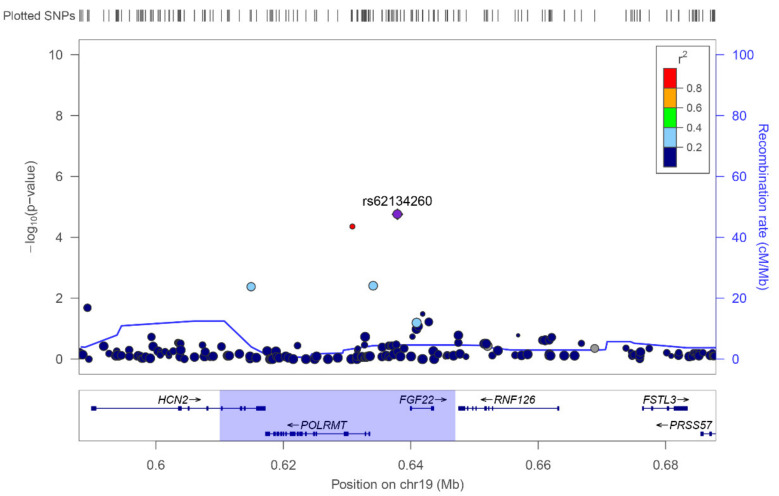
Figure 4.
Genetic landscape surrounding rs62134260, plotted using LocusZoom (http://locuszoom.org/, accessed on 14 September 2021) with imputed data of the extreme phenotypes analysis (discovery cohort). Each dot represents a genetic variant; on the y-axis the statistical significance (−log10(p-value)) is represented, and on the x-axis the chromosomal position. The colour of the dots indicates the linkage disequilibrium value (r2) of the given SNV with rs62134260. The size of the dot reflects the square-root of the sample size (sample size may be affected by imputation quality of each sample). rs62134260 is indicated by a purple diamond. Blue highlighted region delimits the region with r2 > 0.3 regarding rs62134260.

