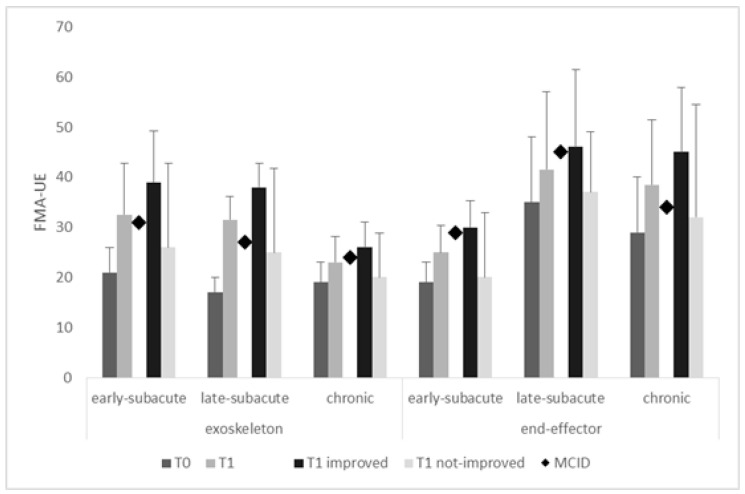
Figure 2.
Fugl-Meyer Assessment for the upper extremity (FMA-UE) in the different subgroups at T0 and T1 (data from all the participants as well as from improved and notimproved patients). T1–T0 comparisons were significant (all p < 0.0001) only in all patients grouped together and in the improved patients (i.e., those who achieved the MCID). The vertical error bars refer to SD. Minimal clinically important difference, MCID.

