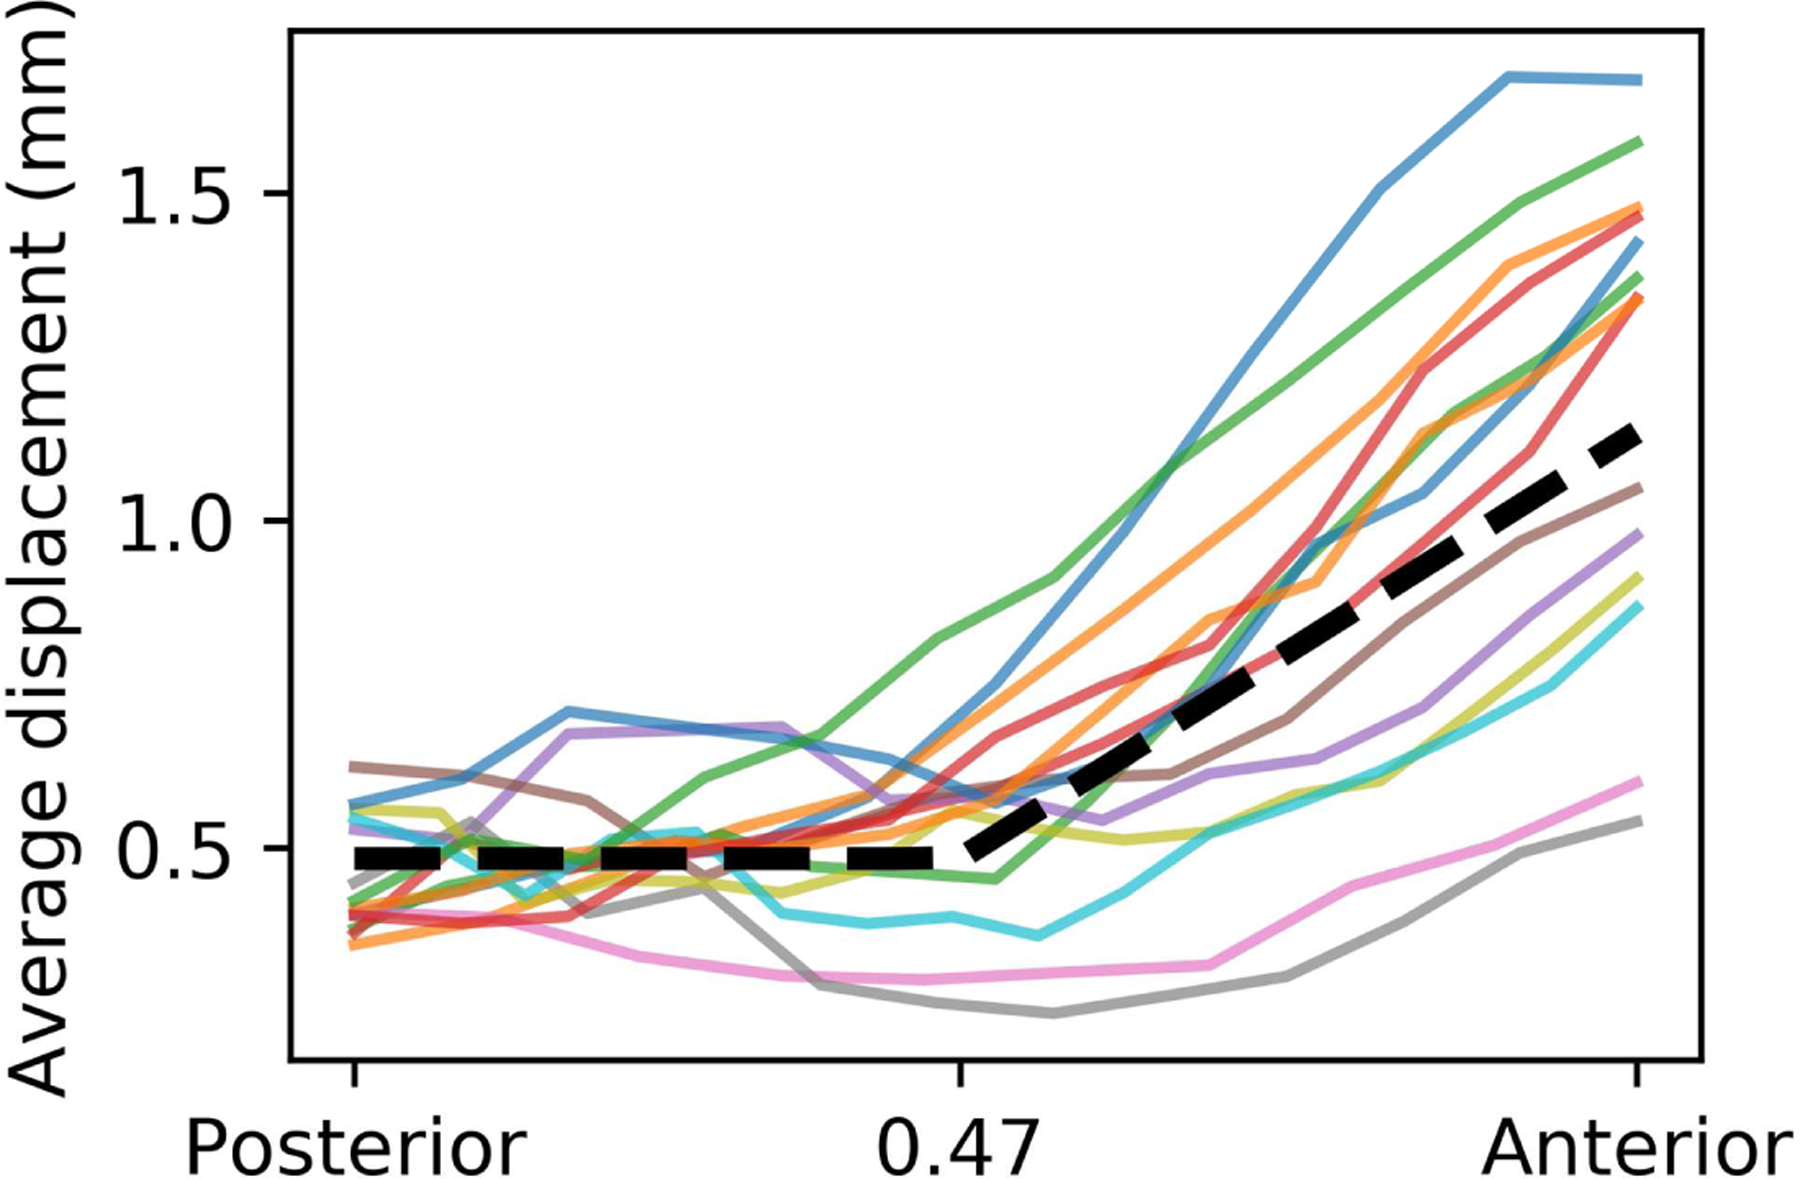
Figure 5.

Average optic nerve displacement as a function of posterior-anterior location. Each solid curve represents one optic nerve’s displacement, averaged over all dMRI volumes (displacement in individual volume could be much larger). The axis ranges from 0 (posterior optic nerve point, near the tendinous ring) to 1 (optic nerve head). The dashed black line represents the step-wise fitting.
