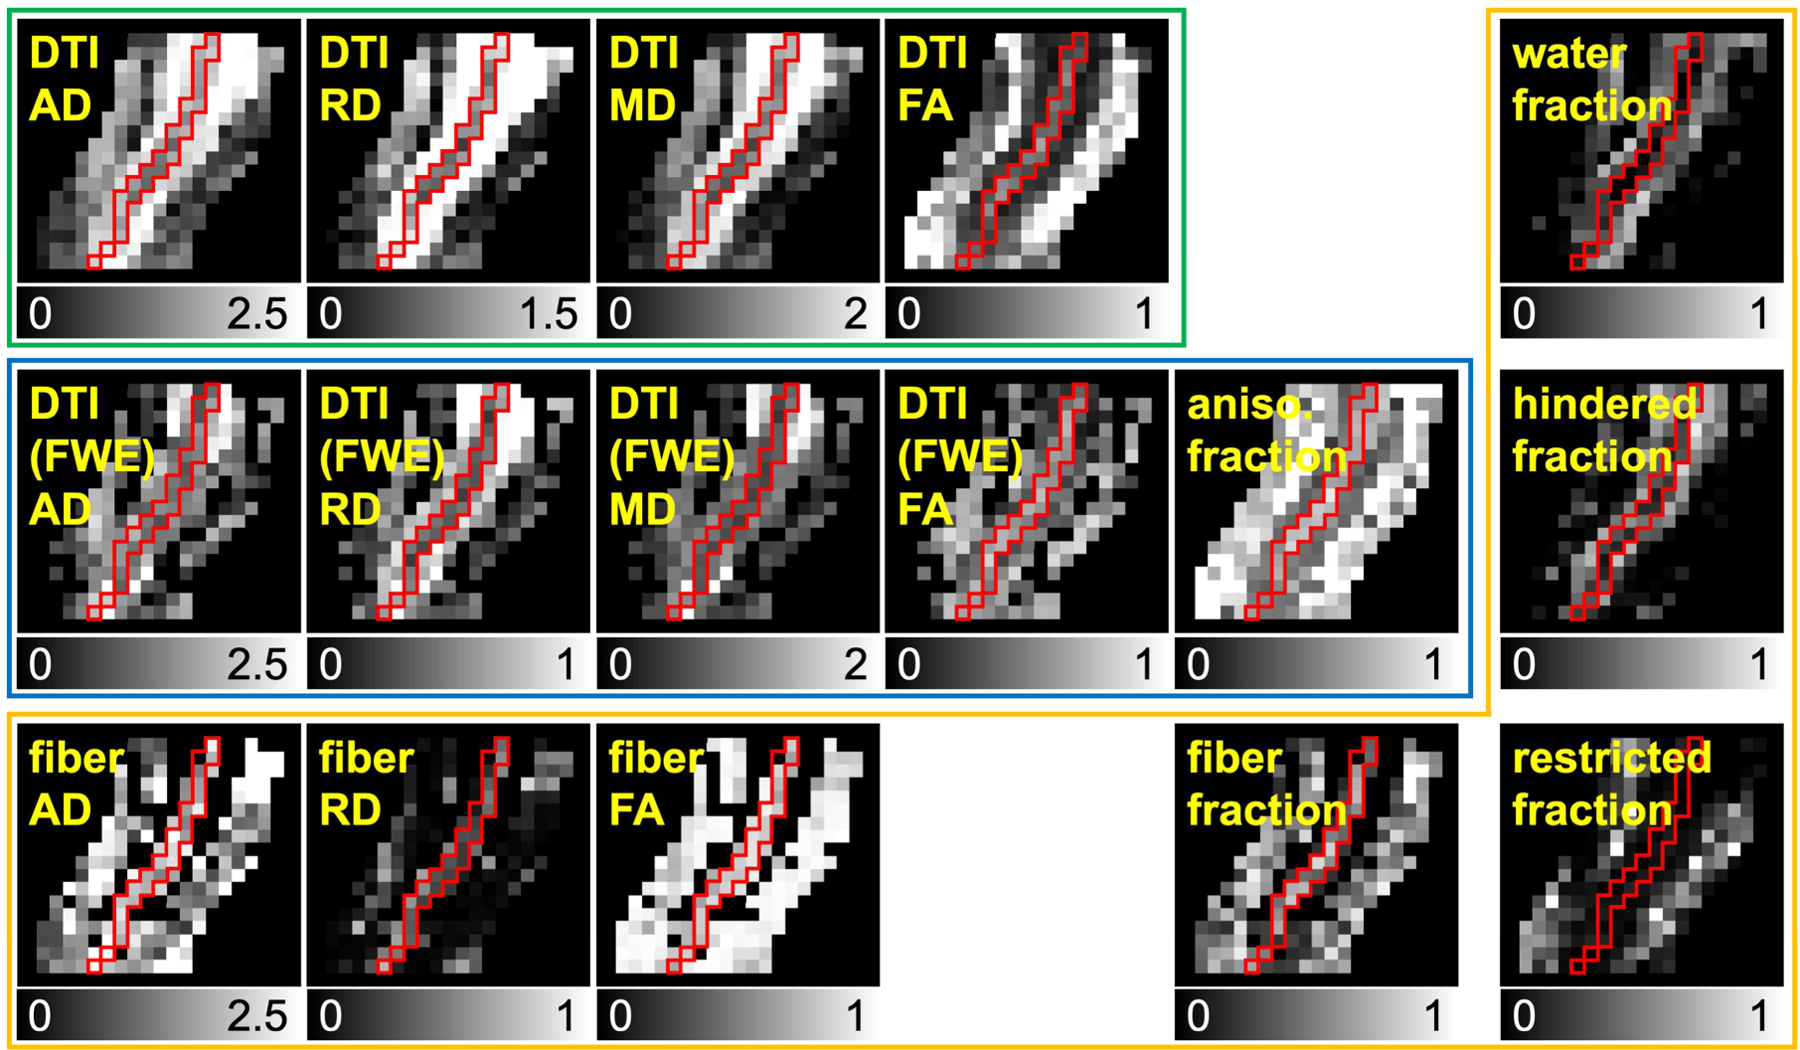
Figure 6.

Representative dMRI metric maps derived from non-linearly aligned dMRI data. The maps inside green, blue, and orange boxes are from DTI, DTI with free water elimination (FWE), and DBSI, respectively. Red boundaries represent the optic nerve location. The grayscales range from 0 to 1 for fractional anisotropy and fraction (i.e., compartment ratio) maps, 0 to 2.5 µm2/ms for AD, 0 to 2 µm2/ms for MD, 0 to 1.5 µm2/ms for DTI RD, and 0 to 1 µm2/ms for DTI (FWE) and DBSI RD.
