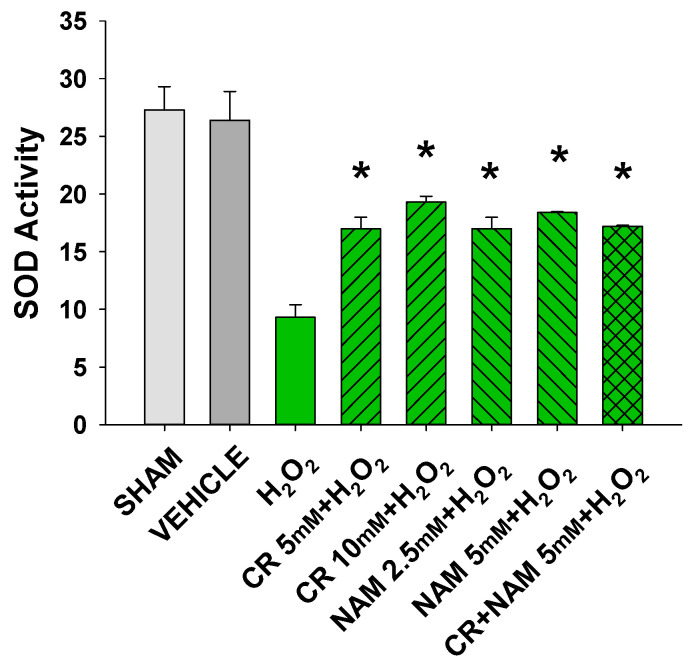
Figure 9.
Effect of Cr and NAM pretreatment on SOD activity. DHF cells were exposed to various concentrations of Cr or NAM alone or combined, media alone (SHAM), or water vehicle (1%). Twenty-four hours later, the cells were exposed to 600 µM H2O2 for 30 min. SOD Assay kit-WST (Dojindo) was used measure SOD activity at that time. The data are mean ± SE from duplicate experiments using triplicate samples. * Denotes statistically significant changes in the Cr/NAM treated levels in comparison to H2O2 alone.

