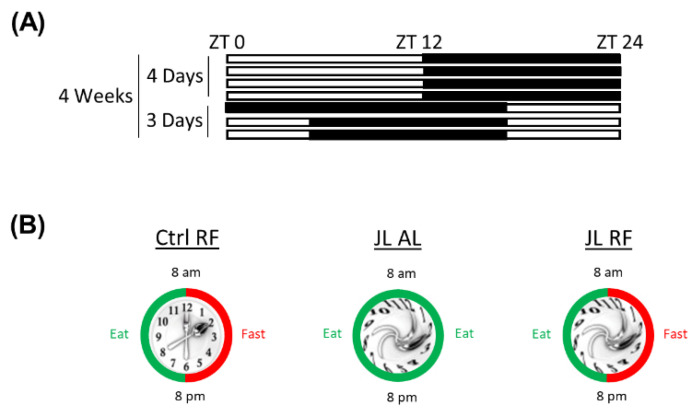
Figure 1.
(A) Schematic representation of the jetlag model. The light phase is represented in white; the dark phase is represented in black. ZT = Zeitgeber time. (B) Graphic representation of control mice fed a TRF diet (Ctrl RF), jetlagged mice fed ad libitum (JL AL), and jetlagged mice fed a TRF diet (JL RF).

