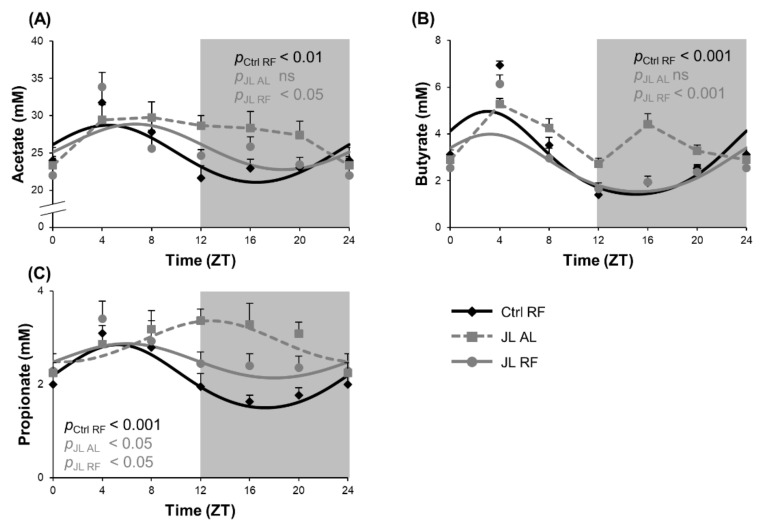
Figure 6.
Effect of time restricted feeding on diurnal fluctuations in fecal SCFA concentrations. Fecal (A) acetate, (B) butyrate and (C) propionate concentrations in the distal colon of control mice fed a TRF diet (Ctrl RF), jetlagged mice fed ad libitum (JL AL) and jetlagged mice fed a TRF diet (JL RF) (n = 8 mice per time point per group). The fitted cosine curve determined by cosinor analysis (period = 24 h) are shown. The dark phase is shaded grey. Statistics: Non-linear regression (Proc NLIN). ns = not significant. p-values refer to probability values for the best fitting cosine curve.

