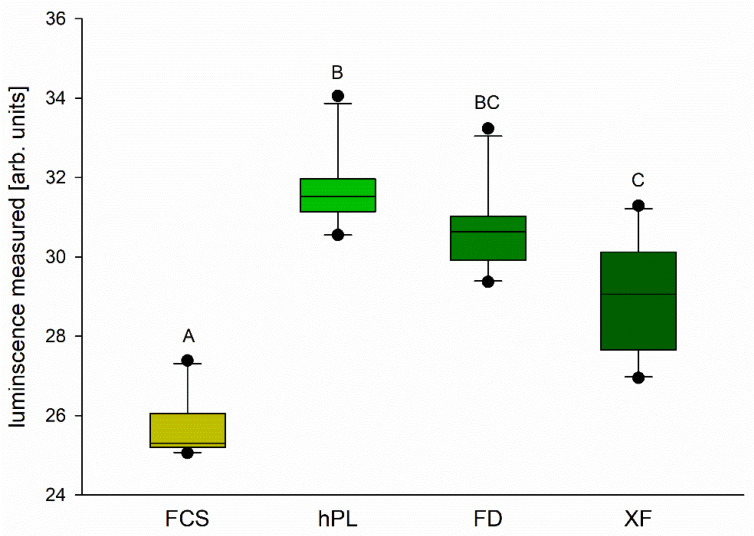
Figure 2.
Cell viability was assessed using a Cell Titer Glo® Luminescent Cell Viability Assay. Boxes represent medians ±10th, 25th, 75th and 90th percentile. Outliers are represented by dots; n = 10, one-way RM ANOVA + Holm–Sidak test, p < 0.01. Different letters (A, B, C) indicate significant differences between groups.

