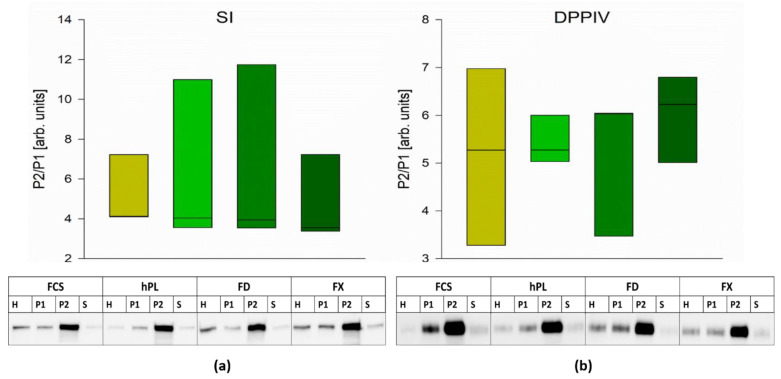
Figure 5.
The expression of sucrase–isomaltase (SI) (a) and dipeptidyl-peptidase (DPPIV) (b) in BBM was assessed by Western blot analysis. To evaluate the grade of protein trafficking to the apical membrane, the ratio between P2 and P1 was calculated and is shown in the graph. Boxes represent medians ±10th, 25th, 75th and 90th percentile; N = 3; one-way repeated measurements ANOVA. Representative blots are shown below. H: cellular homogenate; P1: intracellular and basolateral membrane; P2: BBM; S: soluble and vesicular (endosomal) proteins.

