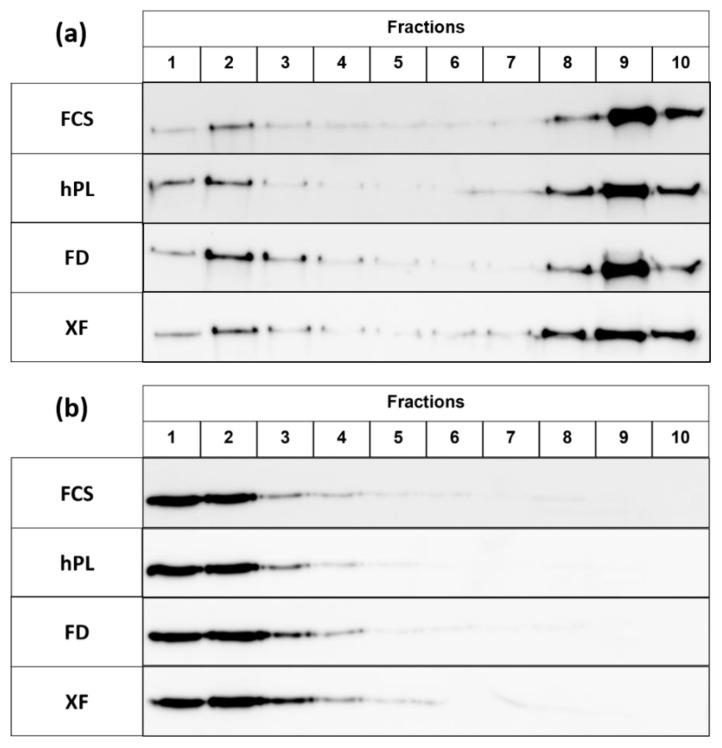
Figure 6.
The expression of sucrase–isomaltase (SI) (a) and FLOTILLIN-2 (b) in lipid rafts (LR) was assessed by Western Blot analysis and compared qualitatively. The figure shows a representative blot of N = 3. There were no differences regarding the localization of the proteins between the different supplements.

