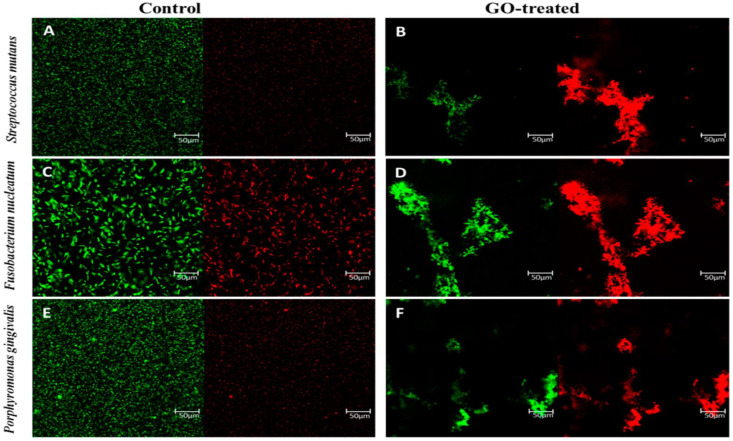
Figure 5.
Images of fluorescent stains that are both alive and dead. S. nutans (A–D), F. mutans, and P. gingivalis cells (E,F) were treated for 2 h with GO nanosheets and isotonic saline (control). Representative fluorescence microscopy pictures of bacteria cells stained for 15 min in the dark with SYTO 9 (green channel) and PI (red channel). The identical GO dosage of 80 g/mL was given to all of the patients. The scale bar is 50 μm [70].

