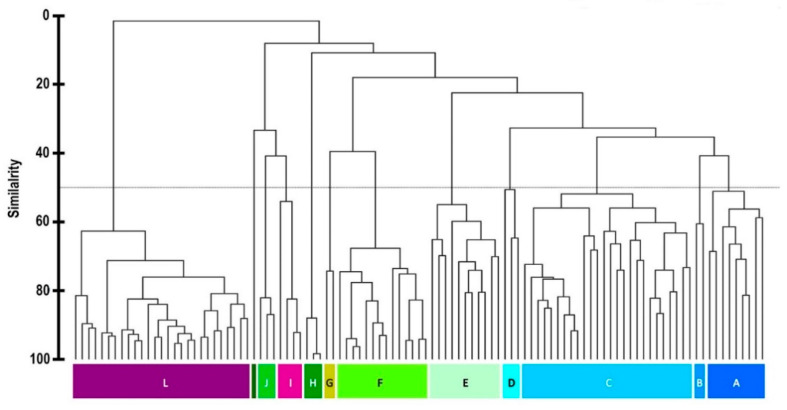
Figure 1.
Bray–Curtis similarity dendrogram showing the relationship of the metabolomic profiles between Plocamium sp. individuals collected in the 2016 field season. Each vertical line at the bottom represents one individual alga. Algae clusters with greater than 50% similarity (dotted line) were assigned as chemogroups A through L.

