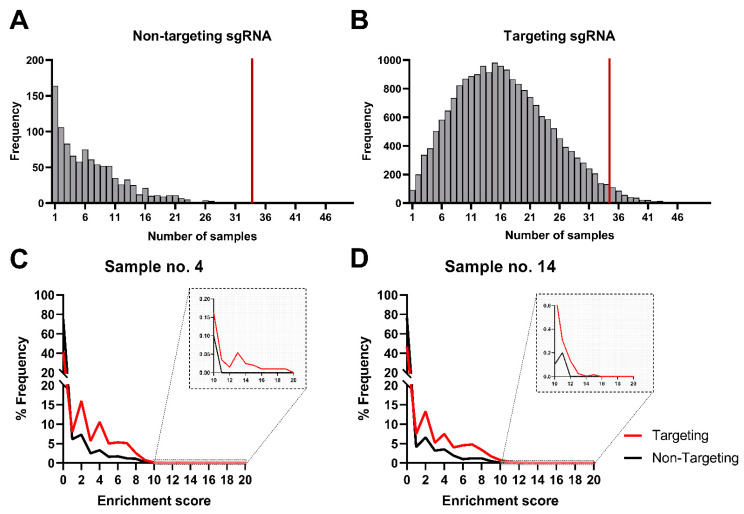
Figure 2.
sgRNA frequency trends in non-targeting controls and targeting sgRNAs. (A,B) histograms present the distribution of sgRNA elevated abundance frequency (y-axis) among 48 samples (x-axis) for both non-targeting control and targeting guides, respectively. (A) summarizes the number of samples for which we detected control gRNAs, not targeting the human genome. The height of each bar corresponds to the number of non-targeting gRNAs that were detected. (B) A similar summary for gRNA targeting the genome is presented. The height of each bar corresponds to the number of gRNAs detected; however, the distribution differs. Panels (C) and (D) show density plots of normalized abundances (enrichment score) for two (from sixteen) representative samples for targeted (red) and non-targeted (black) sgRNA, respectively, which validates the performance of our normalization. The graphs from all 16 samples are presented in Supplementary Figure S3.

