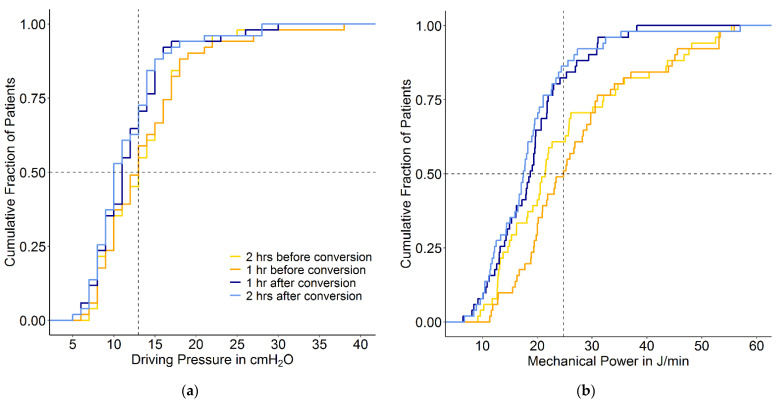
Figure 2.
Cumulative frequency distribution of (a) ΔP and (b) MP. The plots show ΔP and MP 2 and 1 h before the conversion and 1 and 2 h after the conversion from conventional ventilation to INTELLiVENT-ASV. Vertical dotted lines represent the median at the last hour before the conversion, and horizontal dotted lines show the respective proportion of patients reaching each cutoff.

