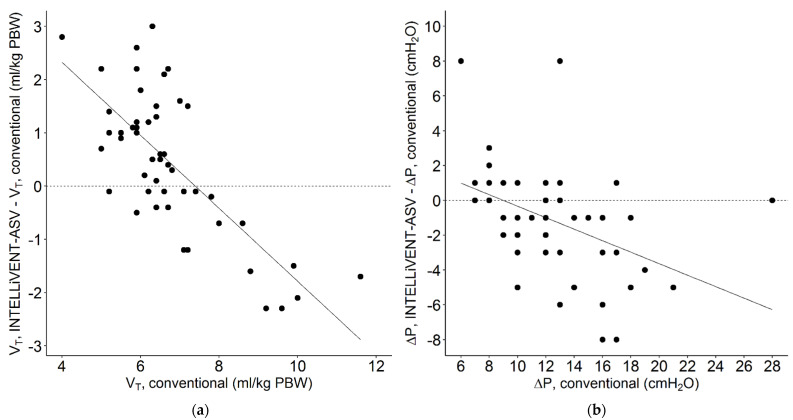
Figure 4.
Scatterplot of individual changes in (a) tidal volume (ml/kg PBW) and (b) driving pressure (cm H2O) when the patients were switched from conventional ventilation, at 1 h before conversion, to INTELLiVENT-ASV (VT, INTELLiVENT-ASV-VT, INTELLiVENT-ASV; and ΔP, INTELLiVENT-ASV-ΔP, conventional) 2 h after conversion. Continuous line; regression lines. Each patient was characterized by a single data point. A negative value for VT or ΔP means that the conversion to INTELLiVENT-ASV resulted in a lower VT or ΔP, and a positive value means that VT or ΔP increased after the conversion.

