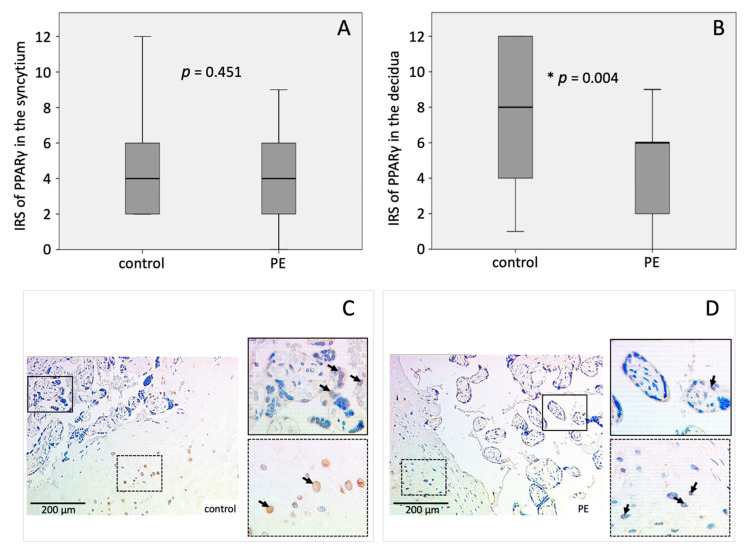
Figure 1.
Immunohistochemical staining results of PPARγ. Boxplots of the IRS in the (A) syncytiotrophoblast and (B) the decidua as mean ± SD; p-values were calculated with Mann–Withney-U-Test; representative immunohistochemical images of PPARγ in controls (C) and PE placentas (D) were chosen, continuous line: syncytium, dotted line: decidua. IRS of control placenta: syncytiotrophoblast = 4, decidua = 4; IRS of PE placenta: syncytiotrophoblast = 4, decidua = 2. The respective p-value indicates, if the IRS of controls and PE differ significantly and was calculated using the Mann-Whitney-U-Test.

