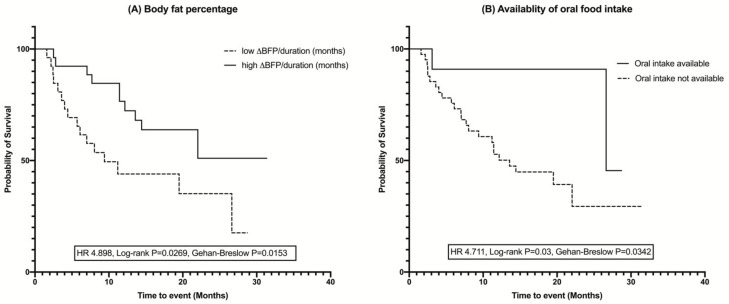
Figure 3.
Kaplan–Meier curves and log-rank test for survival analysis showing the difference in the duration of survival in ALS patients: (A) Body fat percentage, (B) Availability of oral intake. Groups were divided based on the median values for body fat percentage. The higher body fat percentage and availability of the oral food intake increased the survival duration in ALS patients. ∆—interval change (follow-up – baseline values); BFP—body fat percentage.

