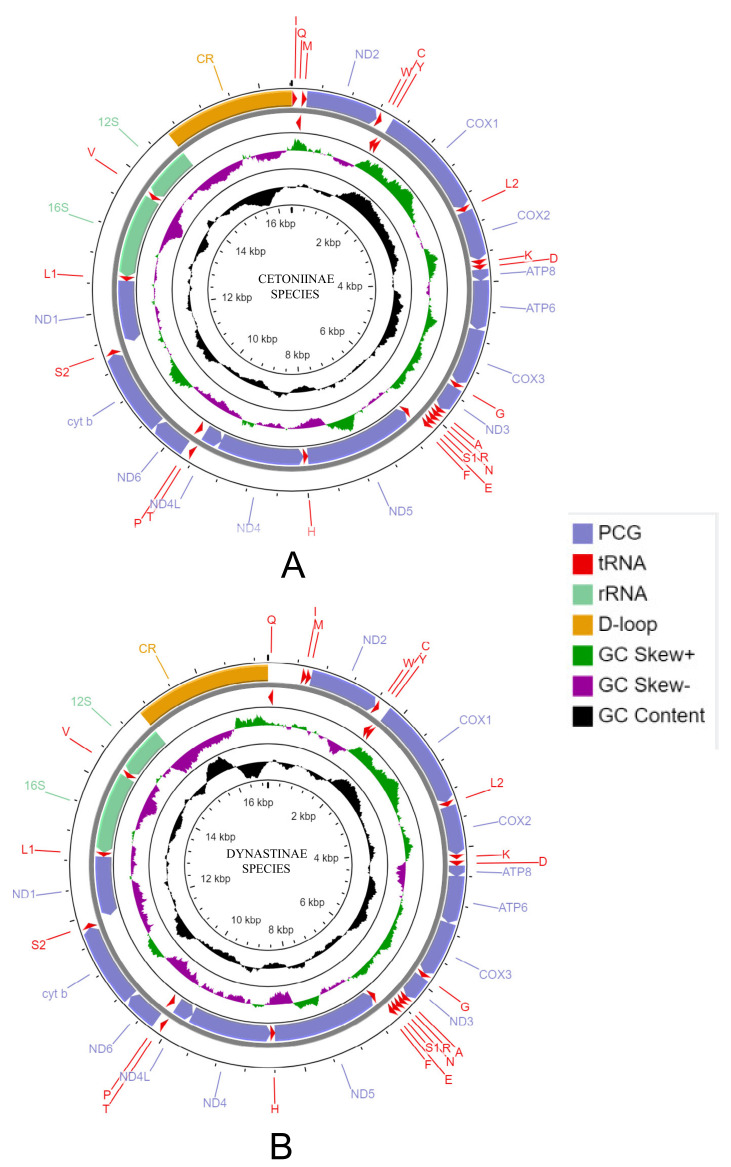
Figure 1.
Representative mitochondrial genome maps of Cetoniinae (A) and Dynastinae (B) species. The first circle shows the gene map (PCGs, rRNAs, tRNAs and the AT-rich region) and the genes outside the map are coded on the majority strand (J-strand) whereas the genes inside the map are coded on the minority strand (N-strand). The second circle shows the GC content and the third shows the GC skew. GC content and GC skew are plotted as the deviation from the average value of the entire sequence.

