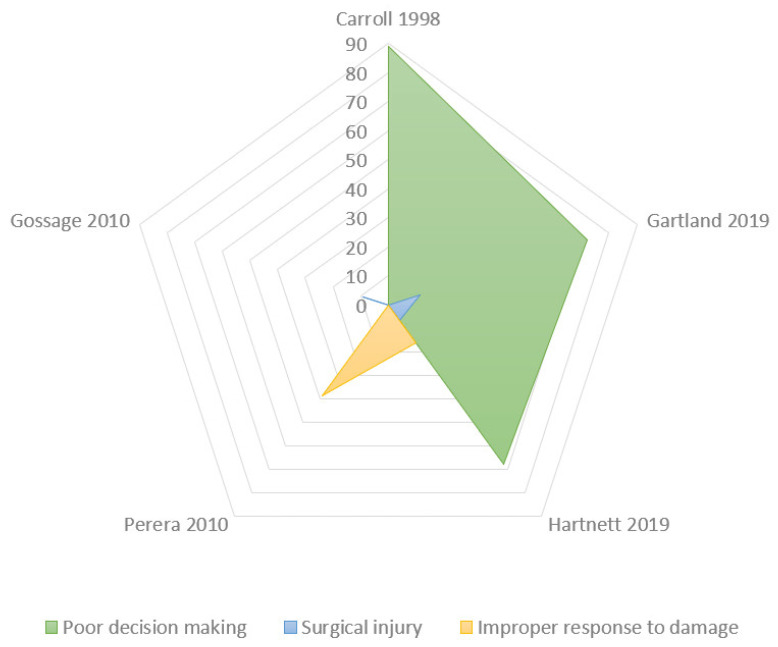
Figure 6.
Radar chart: Causes of improper intraoperative surgical performance. The Radar chart shows the biggest polygon (green area) which is the most common indicator of intraoperative surgical performance: poor decision making or misinterpretation (“problematic visualization”). The areas of the smaller polygons (yellow: improper response to damage; blue: surgical injuries) are particularly small to demonstrate the few cases reported.

