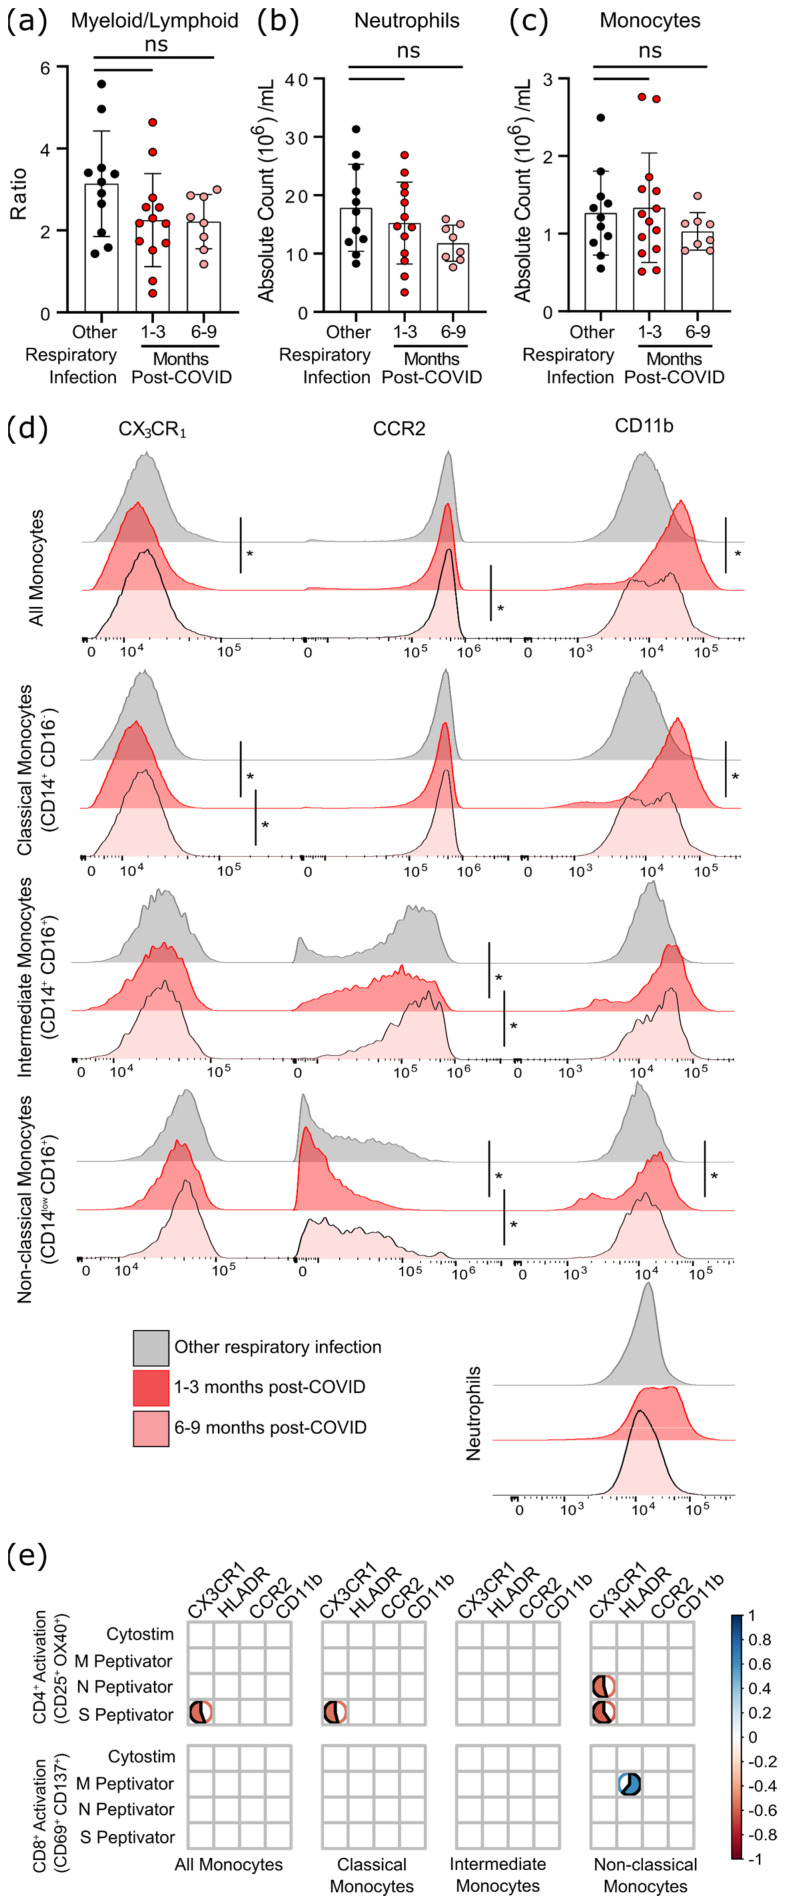
Figure 5.
Evidence of sustained cellular inflammation after mild SARS-CoV-2 infection. (a) There was a trend towards a decreasing ratio of myeloid to lymphoid cells after SARS-CoV-2 infection, compared to individuals recovered from other infections, which was driven by a decrease in circulating neutrophils (b). Although total monocyte numbers did not change after infection (c), surface expression of the migratory markers CX3CR1 and CCR2 decreased transiently (d). Concurrent increases in surface expression of the migration and activation marker CD11b implies that the monocytes were activated. (e) Correlation analysis (Spearman’s correlation) of SARS-CoV-2 specific CD4+ and CD8+ T-cell responses with measures of monocyte activation and migratory potential. Multiple group comparisons in (a–d) were tested using Welch’s One-Way ANOVA and the Games–Howell post-hoc test; in (a–c) bars are presented as mean ± standard deviation, and each dot indicates a participant. The spread of expression of monocyte surface markers in d was visualized by concatenating uncompensated CD45+CD19−CD3−CD56−CD11b+HLADR+CD14+ events in FlowJo for each infection group prior to overlaying geometric mean fluorescence intensity expression data from all participants onto the same histogram plot. Other respiratory infection (grey) n = 11, 1–3 months after COVID-19 infection (red) n = 14, 6–9 months from COVID-19 infection (pink) n = 8. ns—not statistically significant. Data in (e) were assessed with the rcorr function in the Hmisc package in R, and only statistically significant associations are shown. * p < 0.05.

