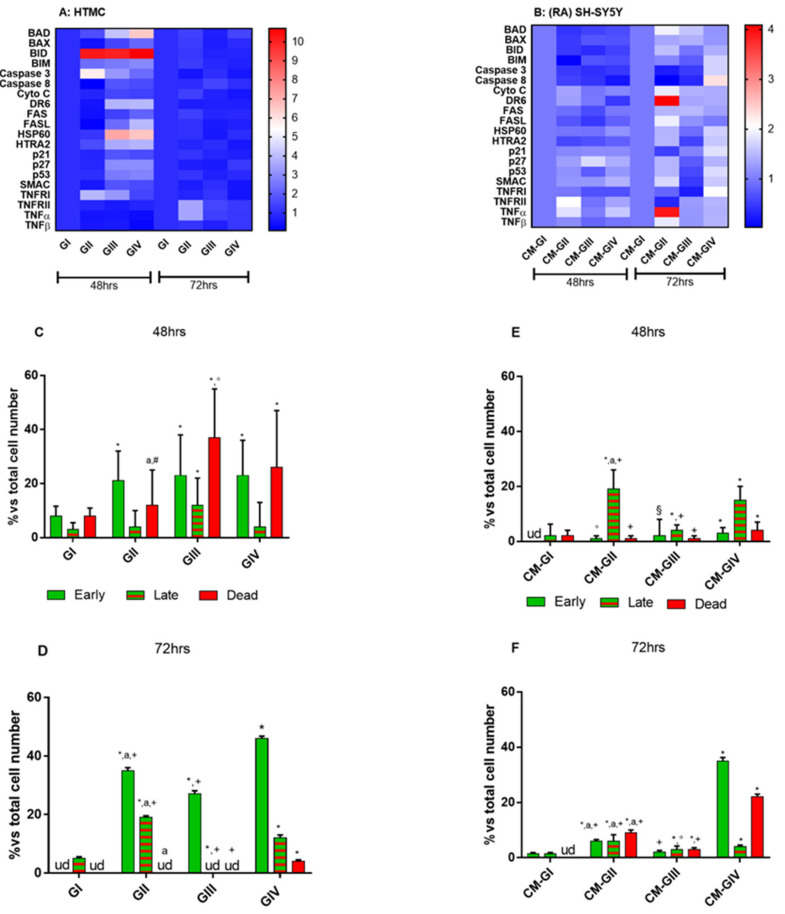
Figure 3.
Apoptosis pathway analysis. Heat map of pro-apoptotic protein levels analyzed both in HTMCs (A) and RA-SH-SY5Ys (B). The color scale represents the value relating to pro-apoptotic protein levels in the various treatment groups. An Annexin V-FITC/PI-stained fluorescence microscope was used to evaluate the different stages of apoptosis in HTMC (C,D) and in RA-SH-SY5Y (E,F). The bar diagram shows early (green bars) and late (green/red bars) apoptosis and death cells (red bars) after 48 and 72 h of experimental procedures. * p < 0.001 vs. control cell group; a, #, +, ° p < 0.001; § p < 0.01 vs. treated cell group (Two-way ANOVA followed by Bonferroni posttest).

