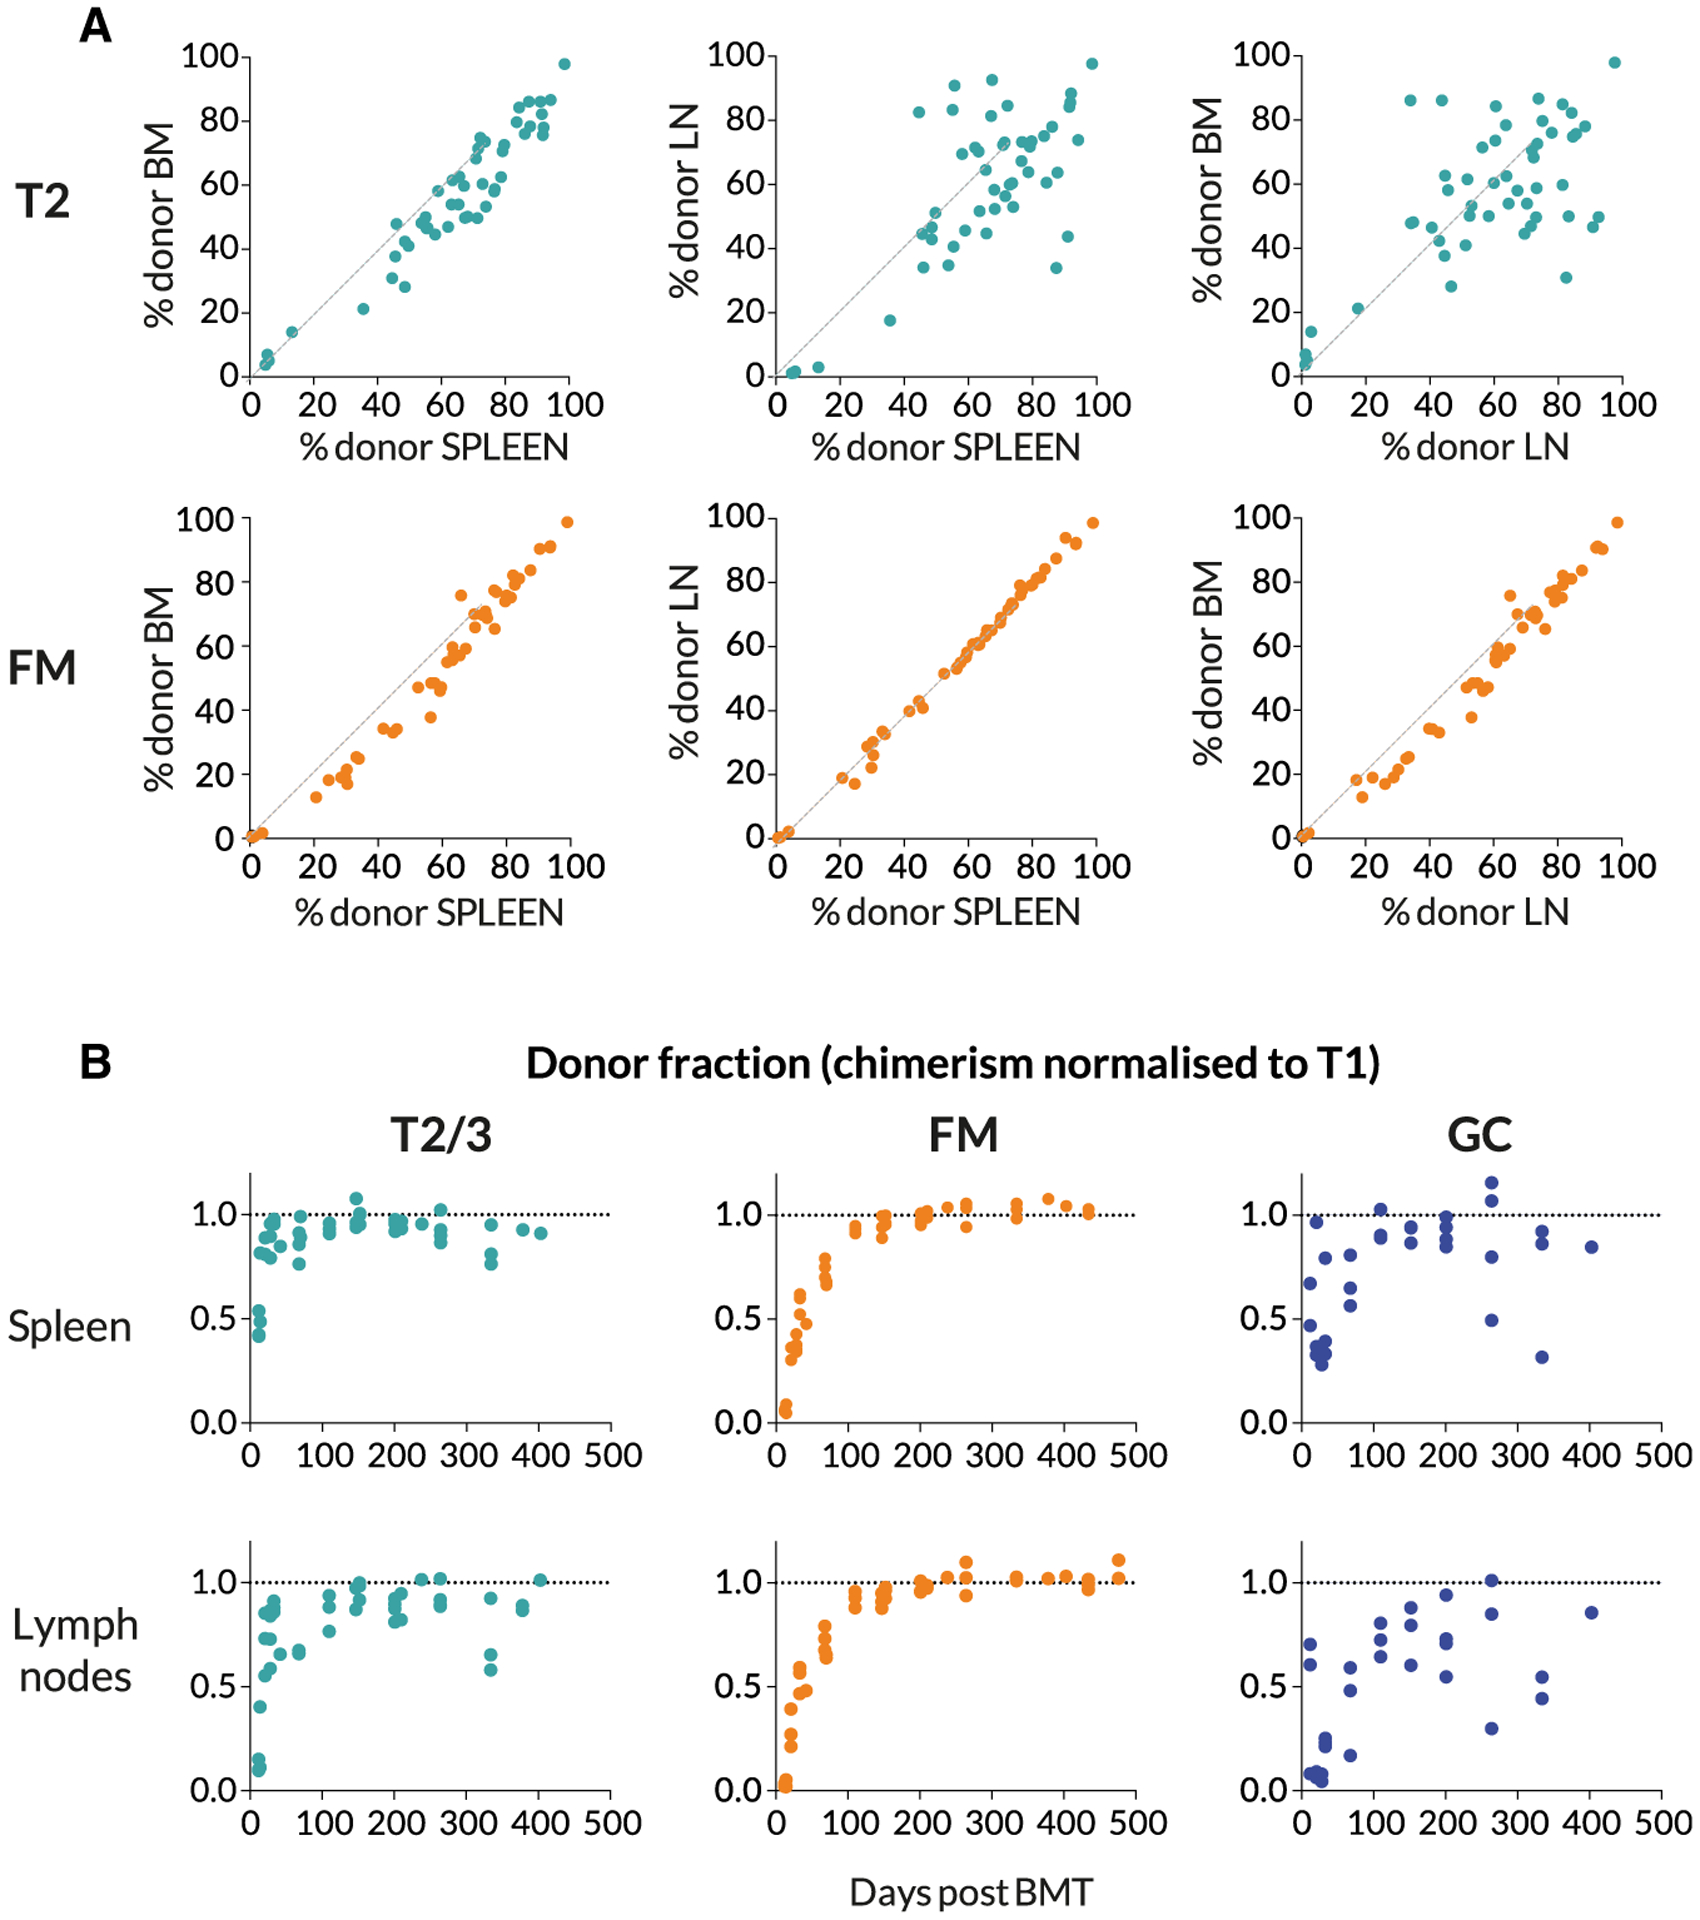
Figure 2. Spatial Distribution and Dynamics of Chimerism in B Cell Subsets.

(A) Comparing chimerism in the T2 and FM B cell subsets across bone marrow (BM), spleen, and pooled lymph nodes (LNs), at multiple time points.
(B) The kinetics of accumulation of donor-derived cells in B cell subsets. The donor fraction in each subset is normalized to that in the upstream T1 subset, to remove the effect of variation in the level of stable BM chimerism achieved across animals.
