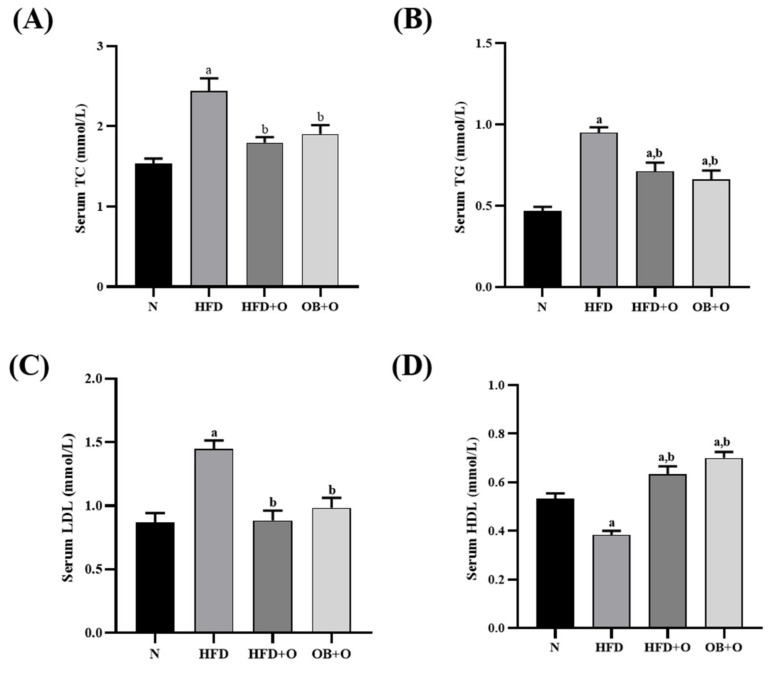
Figure 2.
Serum lipid profiles in HFD-induced MAFLD rats. N, normal control; HFD, high-fat diet; HFD + O, high-fat diet+orlistat 10 mg/kg/day (protective model); OB + O, obese+orlistat 10 mg/kg/day (therapeutic model); TC, total cholesterol; TG, triglyceride; LDL, low-density lipoprotein; HDL, high-density lipoprotein. (A) Serum TC; (B) Serum TG; (C) Serum LDL; (D) Serum HDL. Data are expressed as mean ± SEM, n = 6/group. One-way ANOVA, followed by Tukey post-hoc test. a p < 0.05 vs. N group, b p < 0.05 vs. HFD group.

